If you're not yet exactly feeling excited about the price consolidation -- and 'tis not a stretch whatsoever to say resiliency -- of both Gold and Silver throughout what have been months of anxiety and papered-over negative media bias, it might actually be timely to at least consider chilling the champagne.
Likewise, if you're not yet exactly feeling queasy about the state of the earningless (relative to price) stock market, it might actually be timely to at least consider readying the meclizine.
For on the heels of last week's missive entitled "Gold at Support; S&P at Abort?" we now commence straight away with the following triple-panel graphic showing for each of Gold, Silver and the S&P 500 futures (Spoo) their last 21 trading days (one month), along with their linear regression trendlines, the consistency of such trends as depicted by the baby blue dots, all of which have commenced to curl.
'Tis OK, go ahead and utter it: "Oh my word..."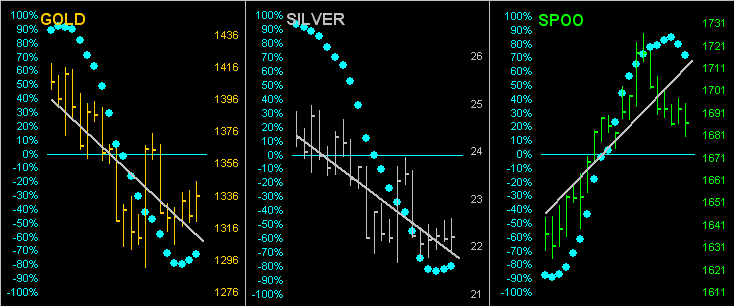
Those of you who each day keep abreast of our three-month views of the Baby Blues, (such version of chart triumvirate upon compression would not be clearly readable across this particular page), know full-well how such dots' curling, just as we are now seeing, oft heralds the reversal of trend, if not the beginning of a major market leg. To be sure, the trend is our friend, which in the above construct remains down for both Gold and Silver, whilst 'tis still up for the S&P. Yet for the metals, the upward curl of the Baby Blues means those downtrends are becoming less consistently so, as is the uptrend for the S&P.
Were it acceptable and within the aggressive trader's risk management profile, one might have bought both Gold and Silver late in the week with protective stops below those panels' lows, and might have positioned oneself Short in the Spoo with a protective stop above the panel's high. That is not a trading recommendation, for you are on your own out there. But 'twill be very interesting to look back at this juncture in a few months time to see if this truly turned out to be a significant reversal of these markets' trends. And truly indeed, yours is not selling his Gold, I can promise you that, especially given such beautiful Golden Curl by the Baby Blues.
Still, our optimistic view of Gold reaching 1500 by month's end is clearly wrong. And from the present 1336 level, given the "expected daily trading range" (EDTR) at the moment being 29 points, neither shall it reach 1400, (although from the "never say never department" Gold has changed day-over-day by better than +4.7669% -- the requisite increase to reach 1400 on Monday -- eight times since the turn of the millennium).
1400, 1500, be such levels as they may, in the big picture, we continue to eye $2,000/oz ... but "when", you ask? First let's assess the state of Gold's weekly bars and then we'll do a little long-term price extrapolation. For the moment, Gold has now recorded seven weeks of parabolic Long trend in the books, per the below chart's rightmost rising blue dots: 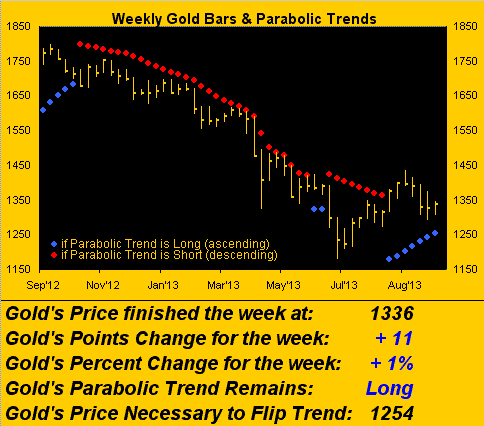
What's interesting here is with reference to our mention at the outset of consolidation and resiliency. This past week was comparably narrow for Gold, its range just 39.7 points from low-to-high, (indeed on a points basis the narrowest of the last 10 weeks). Yet as noted, Gold's EDTR is running at 29 points: hence the consolidation/resiliency action as price has been retracing up and down across the same range. The buyers have been busy, perhaps sensing in their own way, the Golden Curl.
Now let's take that extrapolative peek toward Gold's eventually eclipsing $2,000/oz. Regular readers know that on occasion we present a chart that tracks Gold versus the growth in money supply per the fiat-created measure known as "M2". Therein we've been able to both "prove" that Gold has risen faster than the growth of M2 and is thus too high and that Gold has lagged the growth of M2 and is thus too low. The difference, of course, is from what point in time one begins one's measurement.
Whether ahead of M2's pace or behind it, at the end of the day in the broadest sense, Gold as we're wont to say "naturally" rises with M2, for the simple reason of central banks purchasing the yellow metal to protect their otherwise eroding asset values. Nuff said.
In periodically putting up the chart of Gold along with its 300-day moving average since 2001, we've quipped on occasion that the shape of that average is, until recently, similar to the growth track of M2. Thus our postulation that regardless of whether Gold is ahead or behind the growth pace of M2, price on balance "naturally" rises. Now to the following animated graphic, wherein we've added to the usual price tracks of Gold and its 300-day moving average, the so-called "least squares" linear regression trendline century-to-date ... and then extrapolated it to 05 October 2016 ... 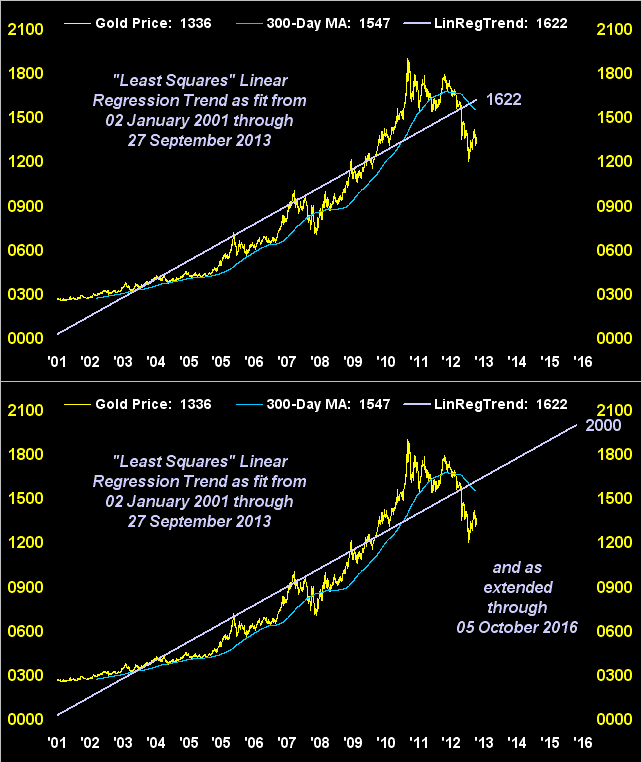
.. on which day at such growth rate Gold, if smack on trend, would tap $2,000/oz. Now before you go off impatiently whining "Do we have to really wait that long?", I've got some good news. Gold moves with far more amplitudinal alacrity than does the terribly ponderous regression line. Yes, 'twould take three years for such line in its current construct to reach $2,000/oz.; Gold on the other hand can itself race up there within one. And in espying the above deviation of price from trend, again, have we not already overcooked it to the downside? A move back up to 1622 trendline level in the chart -- almost 300 points above the current Gold level of 1336 -- would from here, as they say, be merely a "regressing to the mean".
Obviously for Gold to be bid higher, it need be purchased more frequently and its investing base increased. Such catalyst to so do, which has been buried of late by it being "not cool to own Gold", is the re-realization that Gold is not Oil, nor is it the Euro, nor is it Apple, nor is it the 10-year Treasury Note, nor is it Orange Juice. Yet, 'tis being traded as such since "getting ahead of itself" (as we first penned back in 2011). And being traded with a blind eye to that which Gold truly 'tis: MONEY.
Moreover from the standpoint of timing, Gold's biggest ally is the "uh-oh" factor. And I sense much "uh-oh-ing" is sitting out there, ready to pounce upon price: 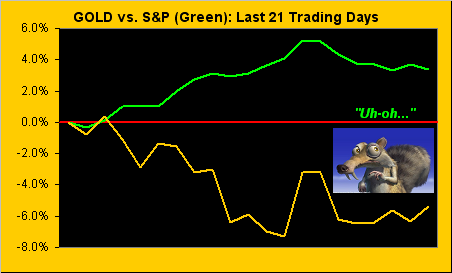
If there's one thing the stock market absolutely cannot stomach 'tis chaos. And come Tuesday, 01 October the chaos commences as the United States flips the toggle switch from arguably the best medical care on the planet to a quasi-nationalized system, wherein under penalty of law, one must purchase health insurance. Or if one already privately has insurance, 'tis said that one's premiums could rise from 30% to 300%. I heard a lady on the radio this past week bemoaning that the $300/mo. health premium for her two kids just leapt to $900/mo. Cute, eh?
But wait, there's more: come Thursday, 17 October, the United States Treasury will be down to its last $30 billion. Remember: at a burn rate of $3.6 trillion per year, that li'l ole $30 billion shall enable the federal government to operate but for three days further before having to send everybody home. Oh say shall that star-spangled banner yet wave o'er the land of the taxed and the home of debasement.
"But, mmb, you know they'll just raise the debt ceiling again ..."
Squire, they've no choice but to so do, else 'tis anarchy that shall ensue. So up with the ceiling, the worthless paper in turn then being purchased by the Fed as their printing presses acceleratively whirl 'round and magically we'll all feel great again. Maybe even lose some weight as that patty melt over at Joe's Cable Car Restaurant becomes prohibitive at $14, (add $3 for a small serving of fries or $5 for the large portion) ... "No thanks, we'll just have water."
Meanwhile, to the casual observer, the stock market appears just fine. Why, the S&P 500 made an all-time high at 1729 a mere six trading days ago. But with respect to all the common sense market measures that no longer matter as spelled out in that paragraph a week ago which was summarized as "Nuthin' but Fed", have a look at the chaos in this next chart. For years, the points change in the S&P 500 (red line) as a rule has been directionally mirrored if not outright led by its moneyflow, (the blue line regressed into S&P points). Nowadays, such pairing has irrationally gone off the boil. In this example we've their respective tracks over the month: 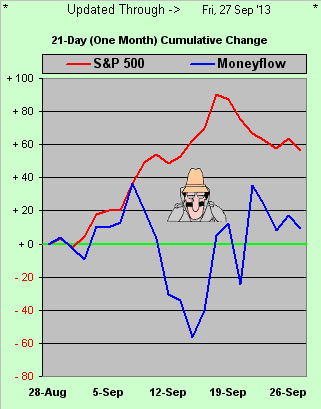
How can one make an informed directional judgment from that mess? If I didn't know any better, I'd swear some villanist beastie must have snuck in here one night, have broken into the computer cases and therein purposefully changed the polarity wiring on the dysgroniphicator circuitry such that our data now just bangs about all over heck's half acre in complete dis-unison. I mean honest to Pete: if the the moneyflow is tanking, how can the market be going up? And then vice-versa?? "Sinister forces are at work!" --(Chief Inspecteur Jacques Clouseau).
Things are indeed quite out of sorts. It oft seems at times we're enduring an environment wherein market moves are attributed to complete irrelevancies. Try this bit from Bloomy mid-week: "Swiss stocks were little changed, following a two-day decline, as investors awaited reports on U.S. durable-goods orders and new house sales." Really? I realize that the Swiss Franc, albeit within its synthetic peg-band to the Euro, traded yesterday (Friday) at its highest level against the Dollar since April 2012, given the aforementioned chaotic as well as quantitative easing reduction concerns; I remain however miffed as to why our Stateside durables and homes sales ought materially affect the price of gruyère in Fribourg. To the Swiss, 'tis been the same price for years. (To the Americans, 'tis increased better than four-fold since 1972, hint-hint, nudge-nudge, elbow-elbow).
Elsewhere, up Berlin-way, Ms. Merkel has won the German Chancellorship for the third time, even though 58.5% of the federal vote went to other participants. Nonetheless, Congrats Angela on your victory, just in time as well for Oktoberfest..
...as we say Stateside, "You da man!"
We'll wrap it here first with the nicely supportive 10-day Gold Profile... 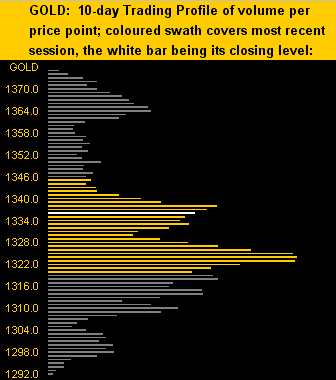
.followed by the Gold Stack:
Gold’s All-Time High: 1923 (06 September 2011)
The Gateway to 2000: 1900+
The Final Frontier: 1800-1900
The Northern Front: 1750-1800
The Floor: 1579-1466
The 300-day Moving Average: 1547
Structural Resistance: 1478 / 1523-1526 / 1535 / 1554
Le Sous-sol: Sub-1466
Base Camp: 1377
Trading Resistance: 1338 / 1364
Gold Currently: 1336, (weighted-average trading range per day: 29 points)
10-Session “volume-weighted” average price magnet: 1331, (directional range: 1292 up to 1375 = 83 points or +6%)
Trading Support: 1324 / 1318 / 1314 / 1310 / 1298
Structural Support: 1266 / 1227
The Weekly Parabolic Price to flip Short: 1254
Keep an eye on that Golden Curl by the Baby Blues. Again: America re-invents itself in the ensuing weeks. (Uh-oh...)
- English (UK)
- English (India)
- English (Canada)
- English (Australia)
- English (South Africa)
- English (Philippines)
- English (Nigeria)
- Deutsch
- Español (España)
- Español (México)
- Français
- Italiano
- Nederlands
- Português (Portugal)
- Polski
- Português (Brasil)
- Русский
- Türkçe
- العربية
- Ελληνικά
- Svenska
- Suomi
- עברית
- 日本語
- 한국어
- 简体中文
- 繁體中文
- Bahasa Indonesia
- Bahasa Melayu
- ไทย
- Tiếng Việt
- हिंदी
The Golden Curl Commences
Published 09/29/2013, 08:11 AM
Updated 07/09/2023, 06:31 AM
The Golden Curl Commences
3rd party Ad. Not an offer or recommendation by Investing.com. See disclosure here or
remove ads
.
Latest comments
Why does your base camp keep getting lower and lower? I will tell you, its because you still haven't been able to figure out that gold is in a bear market and is heading south.
Down down down gold goes again!! When will you learn?
Install Our App
Risk Disclosure: Trading in financial instruments and/or cryptocurrencies involves high risks including the risk of losing some, or all, of your investment amount, and may not be suitable for all investors. Prices of cryptocurrencies are extremely volatile and may be affected by external factors such as financial, regulatory or political events. Trading on margin increases the financial risks.
Before deciding to trade in financial instrument or cryptocurrencies you should be fully informed of the risks and costs associated with trading the financial markets, carefully consider your investment objectives, level of experience, and risk appetite, and seek professional advice where needed.
Fusion Media would like to remind you that the data contained in this website is not necessarily real-time nor accurate. The data and prices on the website are not necessarily provided by any market or exchange, but may be provided by market makers, and so prices may not be accurate and may differ from the actual price at any given market, meaning prices are indicative and not appropriate for trading purposes. Fusion Media and any provider of the data contained in this website will not accept liability for any loss or damage as a result of your trading, or your reliance on the information contained within this website.
It is prohibited to use, store, reproduce, display, modify, transmit or distribute the data contained in this website without the explicit prior written permission of Fusion Media and/or the data provider. All intellectual property rights are reserved by the providers and/or the exchange providing the data contained in this website.
Fusion Media may be compensated by the advertisers that appear on the website, based on your interaction with the advertisements or advertisers.
© 2007-2024 - Fusion Media Limited. All Rights Reserved.