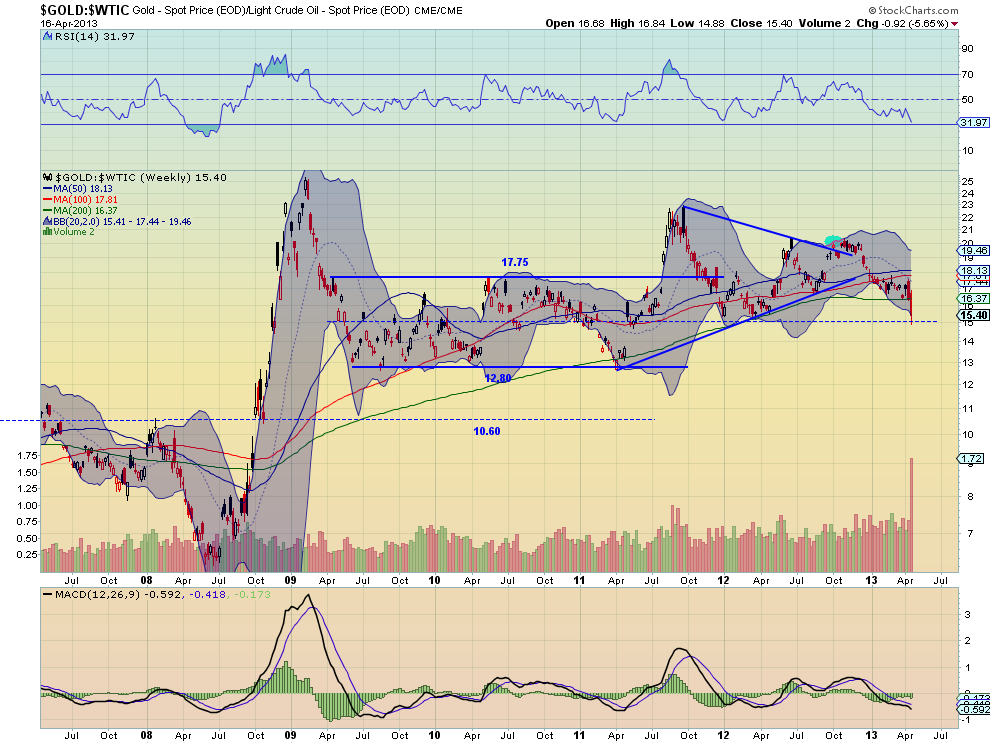
Gold (GC_F, GLD) and Crude Oil (CL_F, USO) are the absolute kings of the commodity complex. And they seem to have a love hate relationship. The ratio chart below shows the large and fast spike in to the height of the financial crisis, moderated back to a steady channel for 3 years before it got a bit jiggy again, raising the channel higher for the last two years. It can also be interpreted recently as a failed break out higher on a symmetrical triangle, and now a breakdown that would target a ratio of 7. This is what makes it interesting. As it sits today it is on the precipice at the 15 mid line of the previous channel. 
A break below that has a gap to fill at 13.78 with support at 12.80 and then 10.60. There are many reasons to watch for this initial break. First, the ratio is below its 200 week Simple Moving Average (SMA) for the first time since September 2009. The Moving Average Convergence Divergence indicator (MACD) is falling and looks to head lower. The Relative Strength Index (RSI) is bearish and falling. These all point lower. The only reason to wait for a break of the 15 level at this point is that the volume this week is very large, and may end up being an exhaustion move. Only time will tell, but this looks ripe for a further decline with a print under 15 this week.
The information in this blog post represents my own opinions and does not contain a recommendation for any particular security or investment. I or my affiliates may hold positions or other interests in securities mentioned in the Blog, please see my Disclaimer page for my full disclaimer.
Original post
- English (UK)
- English (India)
- English (Canada)
- English (Australia)
- English (South Africa)
- English (Philippines)
- English (Nigeria)
- Deutsch
- Español (España)
- Español (México)
- Français
- Italiano
- Nederlands
- Português (Portugal)
- Polski
- Português (Brasil)
- Русский
- Türkçe
- العربية
- Ελληνικά
- Svenska
- Suomi
- עברית
- 日本語
- 한국어
- 简体中文
- 繁體中文
- Bahasa Indonesia
- Bahasa Melayu
- ไทย
- Tiếng Việt
- हिंदी
The Gold To Crude Oil Ratio Is On The Precipice
Published 04/17/2013, 08:50 AM
Updated 05/14/2017, 06:45 AM
The Gold To Crude Oil Ratio Is On The Precipice
Latest comments
Loading next article…
Install Our App
Risk Disclosure: Trading in financial instruments and/or cryptocurrencies involves high risks including the risk of losing some, or all, of your investment amount, and may not be suitable for all investors. Prices of cryptocurrencies are extremely volatile and may be affected by external factors such as financial, regulatory or political events. Trading on margin increases the financial risks.
Before deciding to trade in financial instrument or cryptocurrencies you should be fully informed of the risks and costs associated with trading the financial markets, carefully consider your investment objectives, level of experience, and risk appetite, and seek professional advice where needed.
Fusion Media would like to remind you that the data contained in this website is not necessarily real-time nor accurate. The data and prices on the website are not necessarily provided by any market or exchange, but may be provided by market makers, and so prices may not be accurate and may differ from the actual price at any given market, meaning prices are indicative and not appropriate for trading purposes. Fusion Media and any provider of the data contained in this website will not accept liability for any loss or damage as a result of your trading, or your reliance on the information contained within this website.
It is prohibited to use, store, reproduce, display, modify, transmit or distribute the data contained in this website without the explicit prior written permission of Fusion Media and/or the data provider. All intellectual property rights are reserved by the providers and/or the exchange providing the data contained in this website.
Fusion Media may be compensated by the advertisers that appear on the website, based on your interaction with the advertisements or advertisers.
© 2007-2024 - Fusion Media Limited. All Rights Reserved.
