Over the last few years, on many occasions, I provided analysis on the correlation between the changes in Federal Reserve's balance sheet and the S&P 500 index. To wit:
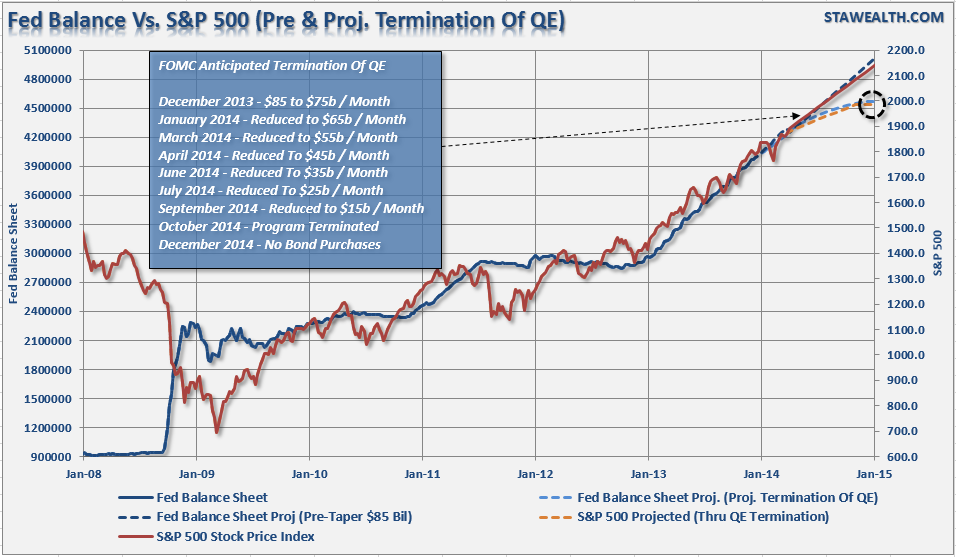
"This is something that I discussed previously. The chart below shows the historical correlation between increases in the Fed's balance sheet and the S&P 500. I have also projected the theoretical conclusion of the Fed's program by assuming a continued reduction in purchases of $10 billion at each of the future FOMC meetings."
"If the current pace of reductions continues, it is reasonable to assume that the Fed will terminate the current QE program by the October meeting."
Of course, the Fed did terminate the latest rendition of "QE" in October of last year. The result was an immediate market swoon as market participants threw a "tantrum" over the removal of the proverbial "punch bowl." However, that correction was short-lived as Central Banks jumped into the "QE Pond" to support asset prices globally either directly or verbally.
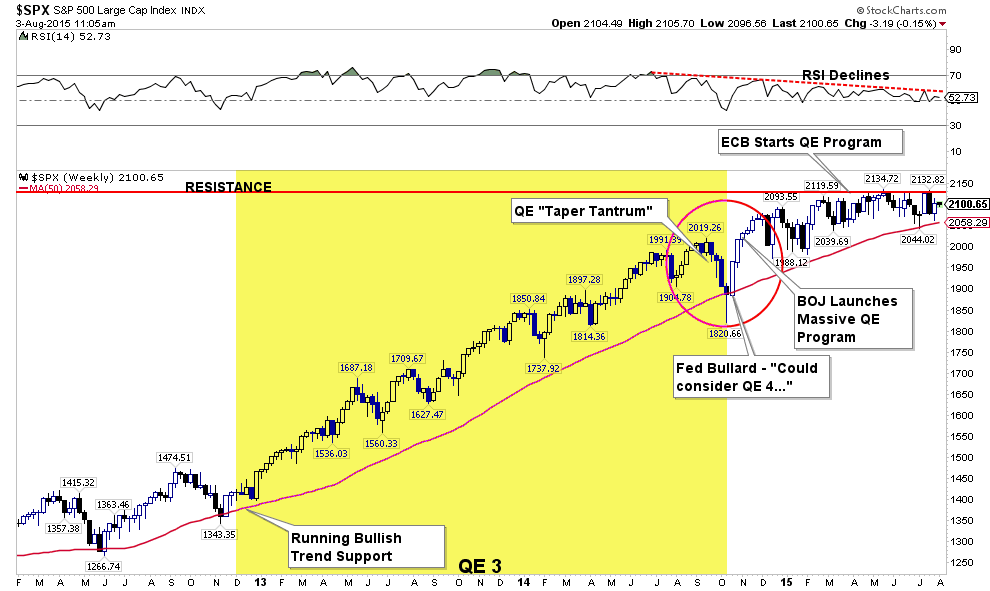
However, despite Japan and the ECB directly intervening into their respective financial systems, there has not been much effect on asset prices domestically. This should not be surprising, as those interventions do not directly impact the "trading desks" of major Wall Street banks to the same degree that the Fed's QE programs do. This is why historically, when the Fed has ended a "QE" program, the markets have begun a more severe correction process. In both previous cases, the Fed leaped into action as the market decline almost immediately triggered a sharp decline in economic activity. It is important to remember that "QE" programs are specifically designed to boost asset prices to lift consumer confidence and ultimately economic growth. What became clear is that without QE, there was no growth.
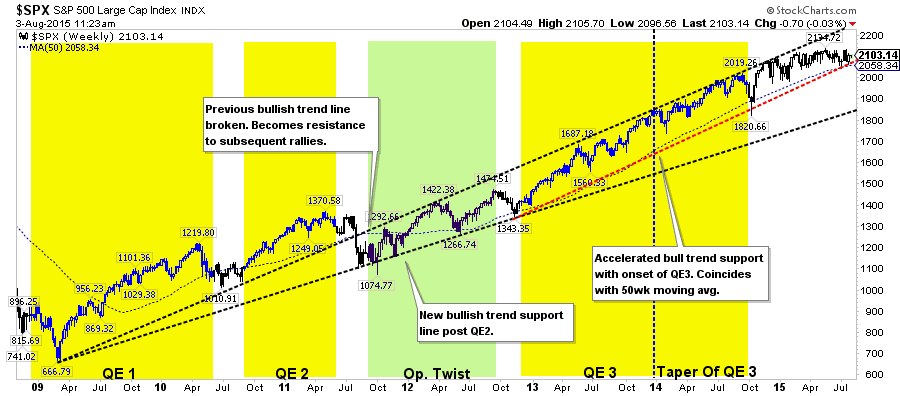
Notice in the chart above, the steep and elongated acceleration of the "bullish" trend of the market following the onset of QE3 at the end of 2012. Then Fed Chairman Ben Bernanke lauched QE3 as an offset to the impact of the "fiscal cliff" imposed by the 2011 Budget Control Act. The BCA, which entailed tax increases and large cuts to Government spending, posed a threat to weak economic growth. The problem came when the "fiscal cliff" turned out to be more of a "slope." The massive excesses of liquidity being dumped in the financial system was the equivalent of blowing "nitrous" into a carburetor. Asset prices soared, but unfortunately, economic growth didn't.
Interestingly, while the market advance has slowed following the termination of the QE3 last year, it has not had a similar correction as was witnessed following past QE terminations. Does this suggest the historical correlation between the Fed's balance sheet actions and the markets has finally been broken? Not so fast.
This is an important question. If the Fed is going to begin an interest-rate hiking campaign, the markets must be operating strongly enough to withstand the negative impacts of higher borrowing costs and reduced risk-premia. Furthermore, while reducing direct liquidity flows "IS" a tightening of policy accommodation, the hiking of interest rates is a "strangle-hold."
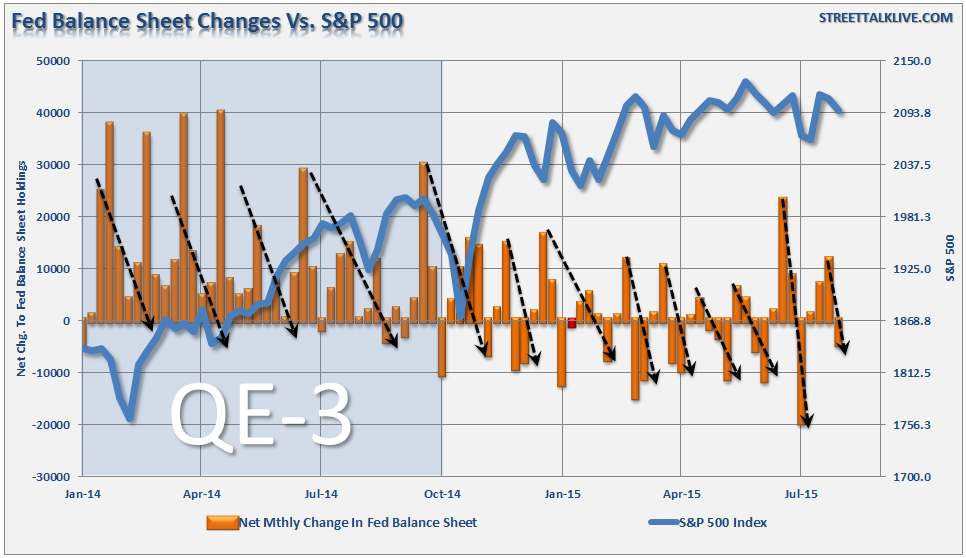
As shown in the chart below, while the Federal Reserve is not currently expanding their balance sheet, they are not reducing it either. In fact, the correlation between the Fed's balance sheet actions and the S&P 500 remains tight as the Fed's actions effects the ebb and flow of liquidity in the markets.
As shown above, when the net monthly change in the Fed's balance sheet declines, the markets have begun to struggle or correct. The Fed then increases purchases and expands the balance sheet leading to sharp increases in asset prices. The net effect since October has been effectively nil in total, but the Fed's buying has been a timely savior of market declines.
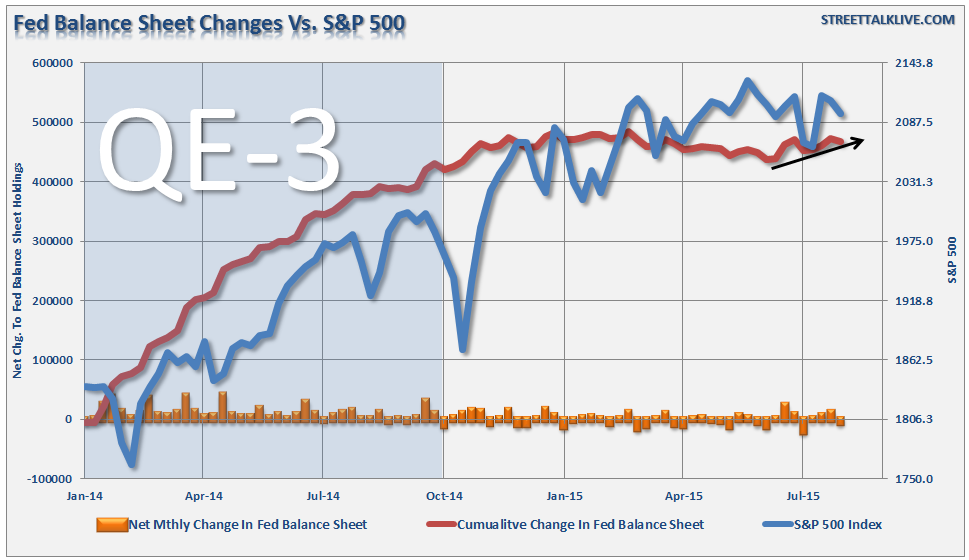
The next chart shows the actual level of the balance sheet relative to the S&P 500. You can more clearly see the flattening of the balance sheet and the market.
As this suggests, the financial markets are still highly dependent upon the flows of liquidity from the Fed either through direct interventions or reinvestment actions.
Much of the mainstream commentary suggests that the markets have been focusing on stronger economic growth. Unfortunately, the reality, as I have suggested many times, has been that growth has been weaker than headline statistics have suggested.
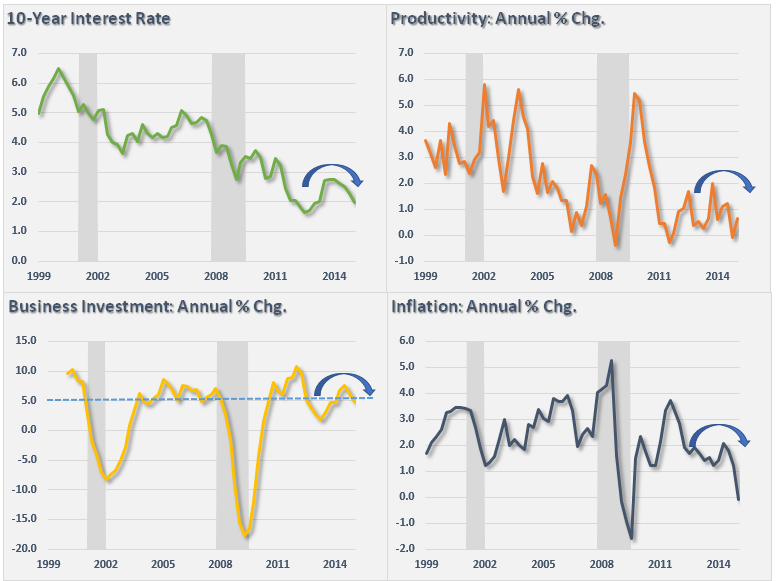
"The real economy, and one that delivers real levels of higher employment, wage growth, and economic stability, is driven by the 'production' side of the economic equation. Individuals must produce first in order to have income with which to consume. Therefore, if you want to measure what is happening in the actual economy, measure what businesses, and the factors that directly affect them, are doing.
The first chart below are Skousen's four leading economic factors."
"Notice the problem here. Despite bullish economic headlines, the four primary indicators have all turned lower in recent quarters suggesting a weaker economy than headlines currently suggest."
While the Federal Reserve continues to "hype" the prospect of increasing interest rates in the coming months, the actual act of "tightening" monetary policy is a different matter entirely. This is particularly the case when the markets are extremely extended and overvalued relative to historical norms.
The Fed is currently caught between a "rock and hard place." The "rock" is continuing to fuel a further levitation in asset prices by keeping policy "extremely accommodative" for far too long. Such would inevitably lead to a reversion that precipitates a collapse in confidence and economic growth.
The "hard place" is the potential risk of triggering an economic recession by hiking interest rates in a slow-growth economy that leads to a severe market reversion.
For the Fed, it is "damned if you do, and damned if you don't." The only hope is that they can somehow walk the fine line between "bubble" and "bust" by navigating the markets, and economy, into a "soft landing." The bad news is that the Fed's own history suggests a probability of success approaching something closer to zero.

