The problem with the cycles in the gold market is they are always changing. There are cycle analysts who use fixed time cycles for gold, and I do too to see what it says; but where the price of gold is concerned, I do not rely upon results obtained using this method.
With that said, it is as important for readers to see what the cycles in gold are saying - even if they refrain from placing full trust in the results - as it is for myself. The things is, when peering through the fog with no sense of what lies within it's murky indistinctness, all partial glimpses are at least some help, though none of them provides full and accurate vision.
This is not a statement from me saying that gold is not cyclical in it's nature. I think it is. But the cycles in gold are numerous and quite complex because each cycle has an effect upon the other cycles; a state usually known as non-linear dynamic systems or chaos theory.
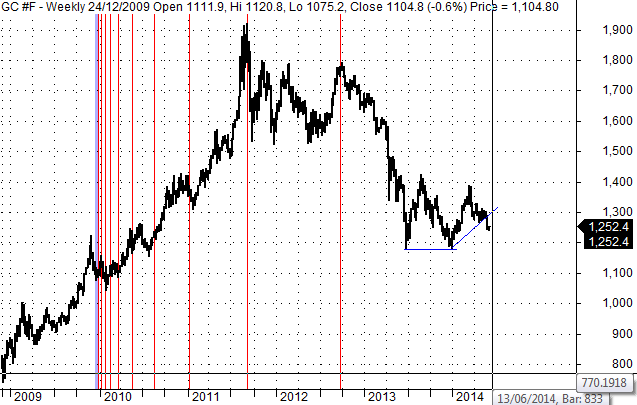
So let's see what the good old basic gold time cycles look like. I have chosen to not plot cycles of great length here today. Though they matter, their lows are indistinct, and I will take the subject of multi-year or decade gold on another time. This is about medium term cycles in the main.
I have also chosen to not show 30 odd cycles which I deem (100% subjectively, but based on experience) to be less reliable than the ones I show here today. But they are in the background tugging and pushing at the cycles I show below. The thing is: gold encloses cycles present in geopolitics, war, bonds, commodities, and fear, together with a few more, all within it's price.
On the whole I present them without comment, except so to explain a peculiar presentation style I use in some cases. I have dated the next turn or points of importance.
The 4 Year Cycle
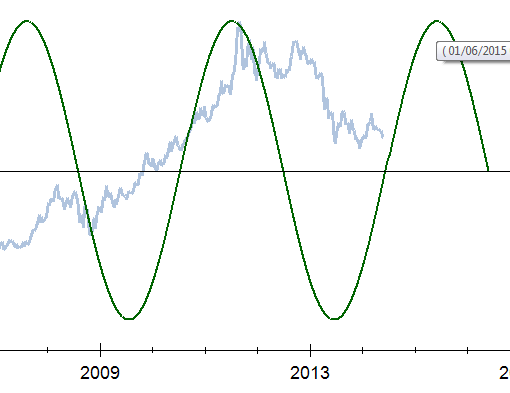
Annual Cycle
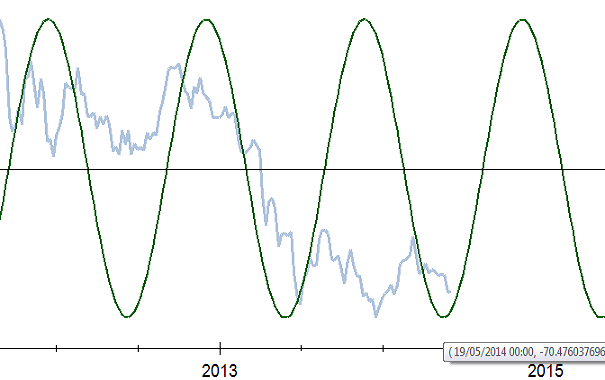
Top 25 Time Cycles
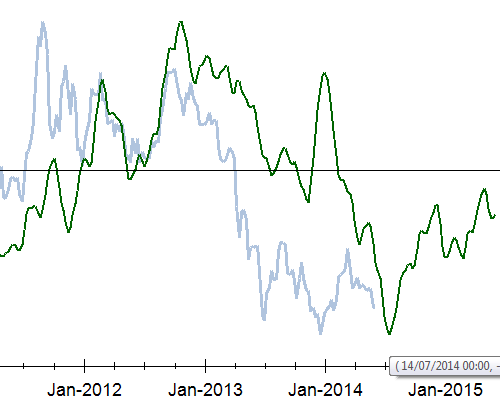
Top 10 Time Cycles
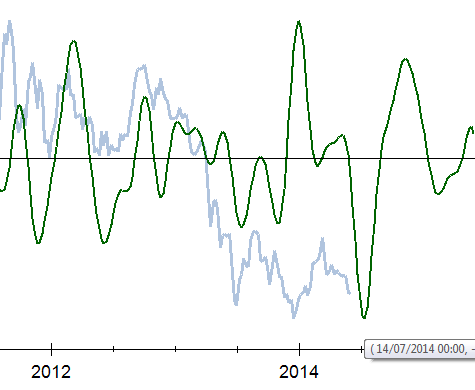
Interesting Fibonacci Cycle
This one previously had a loose fit for several turns, so it does not have a good record so far although it could be strengthening. The last couple of turns were tight, and both were major turns. consequently, the next one requires watching.
Not a Cycle - A Rhythm
This is more about the "form" of the current gold bear, than the passage of time between swings.
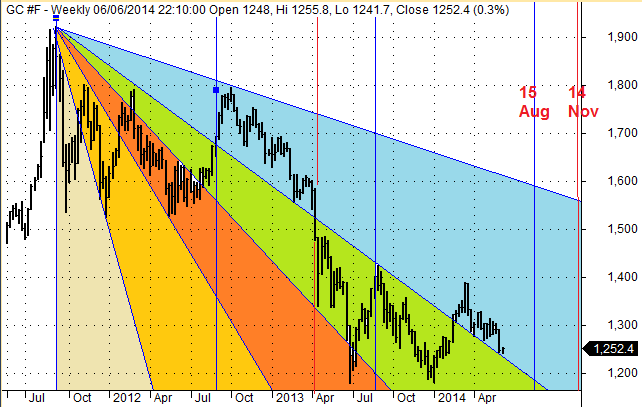
For the recent/current bear market in gold, each downtrend line has "contained" rallies until certain criteria were present. One is that the previous trendline which was under the price had received two taps to confirm it's ability to provide lasting support. After the second probe and rebound, gold was capable of penetrating the overhead trendline and proceeding to the next phase of the bear.
Each of the bear market phases are shaded in colors to clarify. We are in the blue for a second time, because upon the second tap last time gold fell through the underlying support (into the green). Well, gold has regained the blue once more. It is not clear if this is the second of a new double tap or if the first tap is taking the form of a mini triple tap!
I give two dates in this chart. They are simple anniversaries of the entry and exit from the blue on previous occasions, which may matter in regard to the next occurrence. But it may well be that they will not matter. Either way I will pay great attention at those points which are still to come in regard to the status of the old bear, or new bull whichever it happens to be.
My thinking on this difficult facet of the aging bear is that one tap will be enough this time, but we must wait and see. What I think is my thoughts, it is what gold does that matters most.
So I am watching and waiting on this.
But take note, the blue is a wide zone as by now the trendlines have opened up a considerable gap between them. If gold finds support and completes a successful "double tap" upon the declining support, then there is room for a large rally to the upper regions of "the blue". Until then, the absolute levels of both decline a little every day, as they should, because despite bullish calls from the PM fraternity, and despite my purchases in June and December last, the bear has not yet been proved to be dead.
Gold Cross vs Sterling (XAU/GBP)
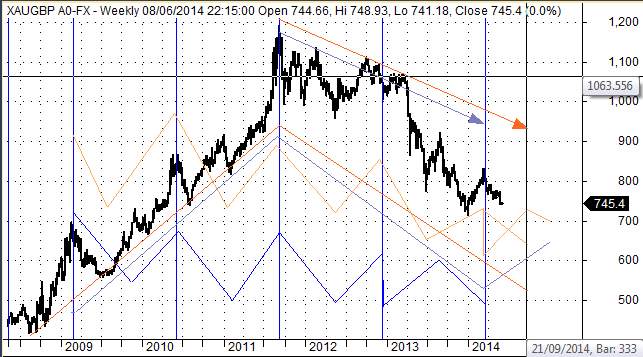
Cycles nested within bigger cycles ..... and with them a date mid September which may bring important events in gold for UK based readers.
No straight answers, just the usual couple of hints. There are no easy signals. The best ones are all full of fear when the time comes to trade. the easy signal has already been discounted and is already in the price, and the market will move against you if or when you take that signal. Take care with simplistic promises from wherever they come. Things are still in the balance, though late-ish in the bear. (Things are always in the balance on some timeframe or other.) There have been longer bear markets, so be neither optimistic nor pessimistic, just be realistic and accept that it feels uncomfortable. The gold bear has become a performance measurement and evaluation exercise. We must observe the little things carefully.
I still think we are building a base, maybe 2/3rds of the way built now. Bases have multiple lows. I accept that and wish to take all the lows which are significant and will continue to try to identify those from the smaller breaks as they stream in.
Disclosure: This is for discussion or entertainment purposes only, and not investment advice.
