Another week, another risk-on rally. US stocks continued to be a leader this past week in global markets. The SPDR S&P 500 Fund (NYSE:SPY) surged 3.3% at the close of the trading week (Aug. 28), marking the fund’s fifth straight weekly advance. Bonds, however, hit a rough patch. Vanguard Total US Bond Market (NASDAQ:BND) fell 0.6% last week—the second weekly loss in the past three.
The weakness in fixed-income didn’t pinch our portfolio benchmarks, at least not much. The US stock/bond 60/40 strategy, for instance, added 1.6% this past week and for the year to date it is ahead by more than 8%. (For definitions of all the portfolios and risk metrics referenced in this article see this summary.)

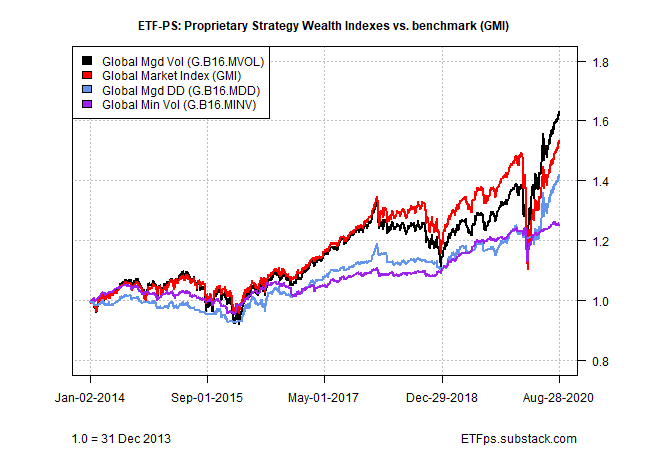
Two of our proprietary strategies continue to deliver strong results, while a third continues to meander. The winners: Global Managed Volatility (G.B16.MVOL) and Global Managed Drawdown (G.B16.MDD) each posted a 1.9% return this week. The trio’s laggard (still): Global Minimum Volatility (G.B16.MINV), which ticked down 0.1%.

Sell signals continue for two funds in G.B16.MDD: iShares 7-10 Year Treasury Bond (NYSE:IEF) and iShares iBoxx $ Investment Grade Corporate Bond (NYSE:LQD). Both funds have been sells for three weeks as of this update. That’s been a good call, at least so far—both funds continue to lose ground and posted losses this week and are moderately below the original sell-signal prices. A third fund, by contrast, shifted back to risk-on after going risk-off previously for G.B16.MDD: as of Friday’s close, iShares Latin America 40 (NYSE:ILF) shifted back to a risk-on position.

G.B16.MVOL, by contrast, continues to remain risk-on across the board, as it’s been since early April.

Here’s how the three proprietary strategies compare against the benchmark—Global Market Index (GMI) since 2014. Note that sidestepping a fair amount of the losses from the coronavirus crash was unusually valuable this year in minting positive performance.

For additional context, consider four asset allocation ETFs managed by BlackRock)—iShares Core Aggressive Allocation ETF (NYSE:AOA), iShares Core Growth Allocation ETF (NYSE:AOR), iShares Core Moderate Allocation ETF (NYSE:AOM), iShares Core Conservative Allocation ETF (NYSE:AOK). These quasi-passive funds, with varying risk profiles, are posting year-to-date gains ranging from 3.8% to 5.4%.

