Recognizing when a recession starts in real time is, for all practical purposes, impossible. The one exception to that rule is if you’re willing to endure a high number of false signals in your model. In that case, you’ll see lots of new recessions starting, but only a handful will be the genuine article. But if reliability with a low error rate is required — as it should be – the usual routine won’t suffice. Instead, you’ll need a methodology that focuses on a broad set of key indicators. No less critical is how you define the analysis of the dataset. An optimal set of indicators won’t mean much if you’re running the analysis with a shaky modeling framework.
Consider the so-called Big Four Indicators – payrolls, personal income, industrial production, and consumer spending. This quartet has been identified by some analysts as the foundation of the US economy. If you had to choose just four indicators, the Big Four set is arguably at the top of the list. There’s no reason why you should limit analysis to just four datasets – in fact, there’s a compelling case to go deeper and wider. But given the popularity of using the Big Four as a rough proxy of economic activity, it’s important to point out that it’s easy to develop a false sense of security by looking at levels rather than rates of change – year-over-year change in particular.
The danger is that looking for recession risk in real time via levels rather than rates of changes is destined for failure. Why? Two reasons. First, it’s hard to model trend changes with levels, which move too slowly to reveal timely warnings. This is an even bigger challenge when you consider that reliable recession-risk warnings will arrive after a new downturn has started.
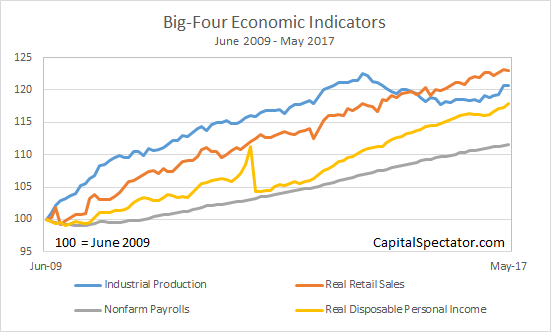
As an example, consider how the Big Four stack up at the moment, with data through May 2017. As the chart below shows, all looks well. The trends are healthy with all four indicators showing upside bias. But looking for recession risk through this lens — via levels — is problematic since history tells us that the trends are apt to remain positive through the early months of a downturn. In other words, a chart such as the one below has little value for business-cycle analysis, at least if you’re trying to decide — with a high degree of confidence before it’s obvious to the world — that a new recession is underway.

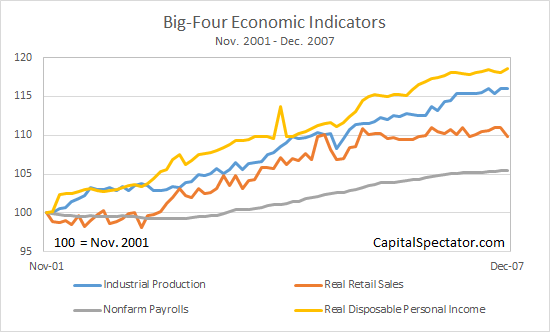
Take the eve of the last recession as an example. The next chart below shows the Big Four (using revised data) as of Dec. 2007, which NBER labels as the “peak” of the business cycle just ahead of the Great Recession. Real retail spending was slightly wobbly at the time, but otherwise it wasn’t obvious that a recession was starting. As such, it was easy to conclude that the macro trend still looked healthy for the US.

As I’ve written previously, calling the start of the last recession in real time – with a high degree of confidence – wasn’t possible until March 2008, or thereabout, based on analysis of vintage data. But if you were looking at Big Four levels, as opposed to rates of change, a reliable warning would come later, too late, in fact, to be of practical value compared with other methodologies.
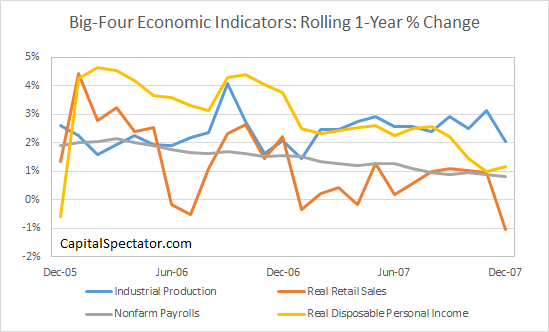
None of this should be surprising. Economic activity slows and eventually declines in recessions, but the shifts are too subtle to be obvious early on if you’re monitoring the business cycle via levels rather than, say, rates of change. For perspective, consider how the rolling one-year changes for the Big Four stacked up as of Dec. 2007, the month that would eventually be labeled the peak for the business cycle. As the third chart below shows, a negative drift in the data is obvious — in contrast with the upbeat profile reflected in the same dataset based on levels. A reliable recession signal would take another 2-3 months of data, but the 1-year changes seem to be ringing a warning below at a relatively early stage.

The lesson is that monitoring levels can be – and is likely to be – misleading if we’re looking for dependable real-time recession warnings.
For the record, recession risk for the US remains low, based on data through May 2017. That could change, of course, and perhaps relatively quickly. But if it does, the regime shift will almost certainly reveal itself sooner, and with more reliability, via one-year changes vs. levels.
