Sales of silver investment coins and bars in the world decreased in 2018 by 4% compared with 2017. Will the XAG/EUR fall?
Such a movement indicates a drop in the price of silver in euros. The GFMS agency published a report on the world demand for investment coins made of precious metals for 2018. The report presents both the annual reduction in sales of physical, investment silver, and the quarterly. In Q4 2018, sales decreased by 3% compared with Q3.
Besides all this, the total demand for precious metals usually decreases when theU.S. Dollar strengthens. It is possible should the Fed hike rates or if the U.S. prevails in trade wars with China and the EU. In turn, the main risk for the euro is the launch of the new money emission in the Eurozone to implement the TLTRO program. As expected, the ECB will disclose its plans on this issue at its next meeting on March 7, 2019.

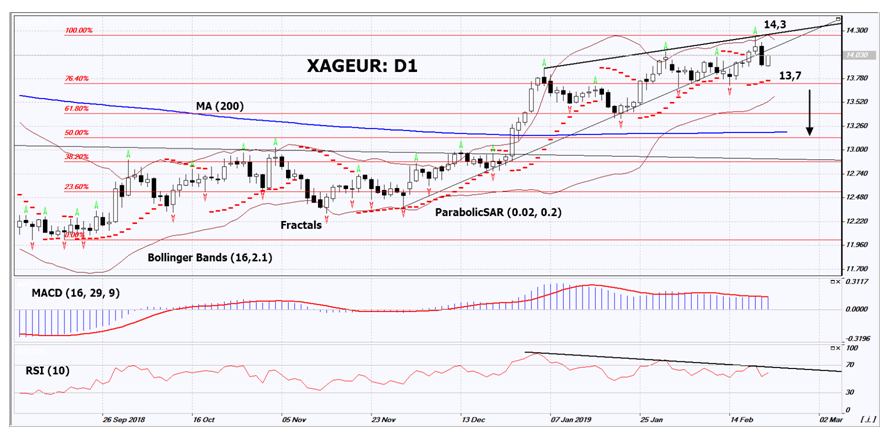
On the daily timeframe, XAG/EUR: D1 has breached down the support line of the uptrend. A number of technical analysis indicators formed sell signals. The price decrease is possible in case of a decrease in world demand.
- The Parabolic Indicator gives a bullish signal. It can be used as an additional support level, which should be breached down before opening a sell position.
- The Bollinger bands have narrowed, which indicates low volatility. The upper band is titled down.
- The RSI indicator is above 50. It has formed a negative divergence.
- The MACD indicator gives a bearish signal.
The bearish momentum may develop if XAG/EUR falls below its last fractal low, the Parabolic signal and the 1st level of Fibonacci at 13.7. This level may serve as an entry point. The initial stop loss may be placed above the last fractal high, the high since June 2018, the upper Bollinger band at 14.3. After opening the pending order, we shall move the stop to the next fractal low following the Bollinger and Parabolic signals.
Thus, we are changing the potential profit/loss to the breakeven point. More risk-averse traders may switch to the 4-hour chart after the trade and place a stop loss there, moving it in the direction of the trade. If the price meets the stop level (14.3) without reaching the order (13.7), we recommend to close the position: the market sustains internal changes that were not taken into account.
Summary of technical analysis
| Position: | Sell |
| Sell stop: | Below 13.7 |
| Stop loss: | Above 14.3 |
Market Overview: All global stock indexes gained
US stock indexes gained in anticipation conclusion of the US - China trade agreement
The S&P 500 peaked from Nov. 8 last year on Friday. In accordance with the futures quotations its growth may continue today. The Dow and Nasdaq indices showed an increase for the 9th consecutive week. U.S. President Donald Trump announced a possible meeting with Chinese President Xi Jingping in Florida.There was no significant macroeconomic data in U.S. on Friday. Today at 16:00 CET data on wholesale stocks for December will be published in the United States. The ICE U.S. Dollar Index is falling today the second day in a row.
European stock indexes also gained
The EUR/USD slightly decreased on Friday. Investors have responded to the fall of the German business climate indicator (IFO) in February for the 6th consecutive month to the lowest since December 2014. Eurozone inflation in January fell to 1.4% in annual terms. This increases the likelihood of preserving the ultra-soft ECB policy. This morning the euro strengthened and regained all the losses on Friday.
A positive factor for the single currency was the confirmation by Fitch of the Italian credit rating at BBB. The European index Stoxx 50 gained due to good corporate reporting and forecasts by IT companies Sopra Steria (PA:SOPR) (+ 17.8%), chip maker ASM International (AS:ASMI)(+ 11.9%) and chemical company Sika (SIX:SIKA) (+ 4%). The Eurozone is not scheduled to publish meaningful macroeconomic statistics today.
The Japanese Nikkei index gained
The main reason for this was the general upward trend in all global stock markets in anticipation of a successful outcome of the U.S.-China trade negotiations. Today shares of Japanese companies supplying their products to China continued to be in demand: Keyence (T:6861) (+ 4.3%), Yaskawa Electric (T:6506) (+ 2.7%) and Komatsu Ltd. (T:6301)(+ 0.9%).
Video game maker Nintendo (T:7974) announced a buyback of its own shares and has gained 1%. Shares of waste recycling company Envipro Holdings (T:5698) soared by 17.4% after it announced that it will recycle lithium-ion batteries.
Australian and New Zealand dollars noticeably strengthened. The main positive for the Australian currency was the rise in prices for raw materials: copper, coal and iron ore. The Kiwi rose due to a 1.7% increase in retail sales in the Q4 in New Zealand. Now market participants expect to accelerate the growth of New Zealand GDP.
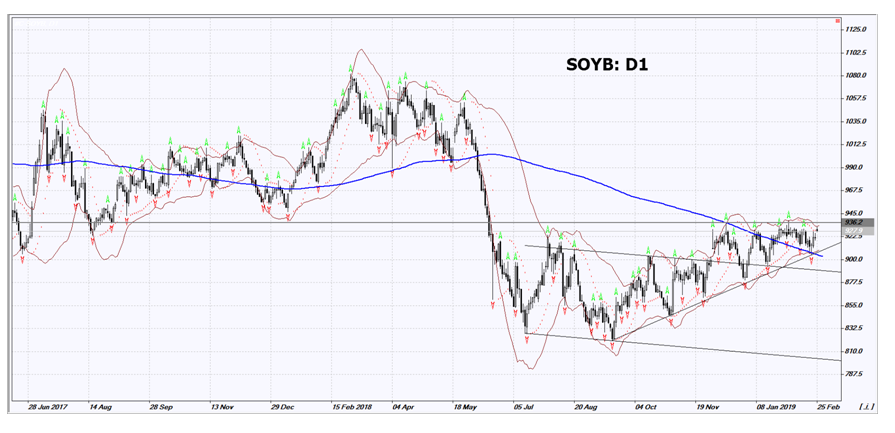
Quotations for Soybean again are close to the medium-term resistance level
U.S. Secretary of Agriculture Sonny Perdue announced that China agreed to purchase another 10 million tons of American soybeans. The deal was discussed during a meeting between U.S. President Donald Trump and Chinese Vice Premier Liu He on Friday. This year China purchased 7.6 million tons of American soybeans, whereas in 2018 it was 26 million tons. The reduction in exports to the PRC was caused by an increase in customs duties in the framework of a trade war. Now the situation is changing for the better.

