The almost universal global central bank push to a more dovish structure has been given further momentum, with a cohesive message delivered in a 24-hour period by the PBoC, Swedish Riksbank, the BoJ and Bank of Canada.
Inflation and inflation expectations are at the heart of the thought process now, and the result of this further shift has been some punchy moves, notably in the SEK, which is currently 7.1% lower against the USD YTD and 320 basis points weaker than any of currency in G10 FX. The Riksbank pushing back on its tightening plans, while announcing an 18-month bond-buying program, has hit a market already seeing fragility in Swedish economics, spurred on by its close relationship with Europe.
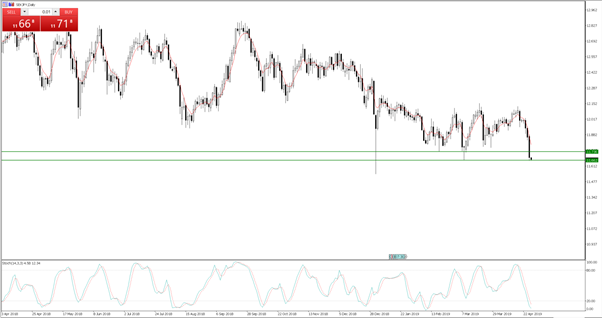
NOSEK has found good buyers, despite the NOK’s close relationship with Brent crude, which is 0.3% lower in Asia and remains a lower beta play on a central bank divergence. We see price working in a bullish channel since January, and it feels like this will be higher in the short-term. SEK/JPY (see below) is a compelling alternative to short EUR/JPY, and a weekly close through 11.66 should send off signals that this pair goes nicely lower, and should we see higher volatility in markets, then we have some protection in the form of leverage to the JPY.
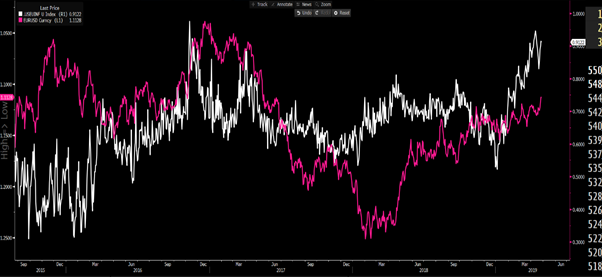
Add in a weak IFO survey in Germany on Wednesday night, arguably the best precursor of economic performance in Germany, and it’s all sellers in EUR/USD. The better US durable goods orders overnight and capital spending have enforced a rising view that the US economy is back as an island onto its own, but that can’t last too much longer in my opinion. Either way, the set-up we see below makes it incredibly hard to be long EUR’s, especially as we see inflation expectations moving up aggressively in the US relative to Europe. I have charted this using EUR/USD (Inverted – pink) versus US-EU 5y5y forward inflation swaps (white), and as long as relative US inflation expectations are moving higher then EUR/USD will be sold on rallies, especially with further dialogue emerging from ECB officials on re-starting its QE program.
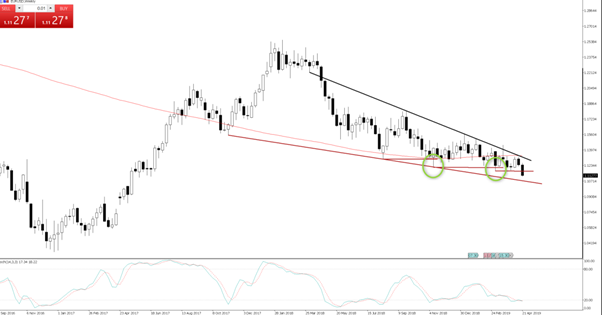
As we can see in the EURUSD (weekly), and throughout the recent downtrend, is that EUR/USD has been prone to a number of failed breaks. Specifically, in the weeks ending 11 November and 3 March, and that makes tonight’s close important, as it would confirm the weekly close through 1.1176 and target a near-term move into trend support at 1.1080. EUR/USD overnight implied vol sits at 5.2%, which gives an expected move of 49-points on the session. So, unless we see a disastrous US Q1 GDP (22:30aest tonight), then the US growth numbers shouldn’t cause a strong USD reversal.
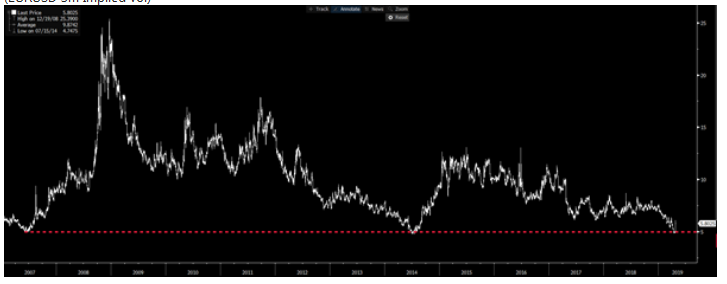
Turning our attention to the USD, and specifically, the USD index (USDX), the break of the multi-month ceiling has garnered much attention and rightly so. I have been in the camp that the USD had downside potential, but would not act and sell USDs until the market compelled, and we saw money flow aligning. We had eyed a situation where a break out in the USD coincided with higher implied vols, and that seems to be playing out, with three-month EUR/USD implied vol finding vol buyers off multi-year support.
Keep the USD index chart on the radar though, as the US data rolls in a big way next week, and could re-enforce this issue that the US is moving apart, with capital continuing to be allocated here. On Monday, we get US core inflation, and this takes on new meaning after Chicago Fed president Charles Evans noted that any moves through 1.5% could be the trigger to cut the fed funds rate. We should hear more about trigger to ease the fund's rate in Thursday’s FOMC meeting, and governor Powell’s presser 30 minutes later. While we also get ISM manufacturing, Employee Cost Index (ECI), non-farm payrolls and services ISM, so it’s a big week on the data front.
With 28bp of cuts priced into US rates markets for 2020, the market is still of the view that an insurance cut becomes a reality, and it seems logical that a one-way USD is not going to be taken well by EM assets, the Trump administration, or a Fed concerned about its own inflation trajectory.
Tactically, gold is back on the focus-list, but until we see the market lose love for the USD, then price should chop around and further consolidate. If we can see a weaker USD then gold flies in my opinion, as the investment case for gold remains solid. That being, a hedge against economic fragility and global disinflationary forces.
In the top pane, we see gold, US 5yr ‘real’ yields (green) and the total $ value of outstanding bonds with a negative yield (purple). The lower pane shows US 5-year forward inflation expectations, and this is important as it dispels the notion that gold is a hedge against inflation, and while that may have been the case throughout history, as we can see, there are periods where gold works inversely to inflation expectations.
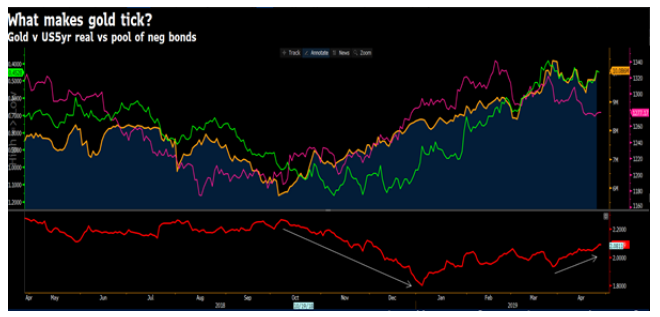
What is clear is that gold is working incredibly well as the best alternative. So, when inflation-adjusted, or ‘real’ yields are moving lower, gold is moving higher. As bizarre as it sounds, the theory is, if yields are falling and the pool of bonds commanding a negative yield is expanding, the fact gold has no yield is yield in itself! As I say, if the market loses its love for the USD then gold rallies as the ‘best house in a bad neighbourhood’ and the best alternative.
We have seen small buying in AUDUSD, and once again the market is defending the 70-handle with real vigour. The intra-day move in AUDUSD looks to have been strongly influenced by USDCNH (yellow and inverted) though, which we can see here.
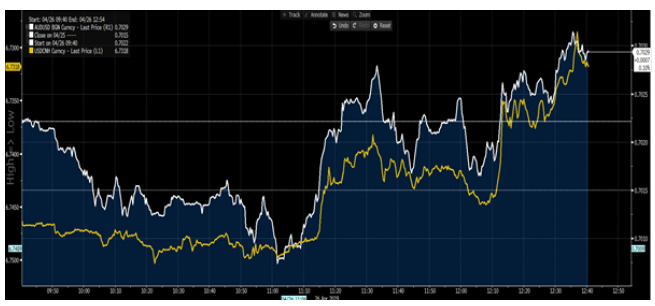
So, put USD/CNH on the radar too, especially if trading AUD/USD, as we have seen a failed break in USD/CNH through horizontal resistance of 6.7143 and if this pair had pushed through then I am sure we would see AUD/USD firmly through the 70c. It feels as though USD/CNH could have important implications not just for AUD/USD, but many other USD pairs in general.
It's also interesting to note that we have started to see the sell-side strategists looks at the effectiveness to generate inflation through further declines in the cash rate. Citigroup putting out a note titled “Time for the RBA to Deploy the Helicopters?”, Which examines the potential of the RBA to look at unconventional monetary policy measures in Australia. This is incredibly interesting, as I would have to agree that having a cash rate at 1% is unlikely to spur huge AUD movement to deport its disinflation, and we don’t want to be talking about negative rates. It seems likely a more mainstream conversation will play out in the months ahead on the RBA going down a route that avoids negative rates and either sees a radical shift in the domestic money supply, or RBA’s balance sheet. For those bearish on the AUD, this is where you will see returns flashing….
