Summary: Long periods where the S&P trades sideways in a range is not unusual. There have been at least 15 similar situations in the past 35 years, about one every two years. Some of these have lasted as long as two years. Most of these have resolved with the S&P moving higher. We've been in a trading range for 7 months; settle in, this could go on much longer.
Over the past 7 months, the S&P has traded in a range of about 7%. After the high volatility of 2009-12 and then the rapid, uncorrected appreciation of 2013-14, this seemingly tight trading range is being regarded as an anomaly.
Is it unusual? Or bearish?
The answers are 'no' and 'not necessarily'. Over the past 35 years, there have been trading ranges as tight that have gone on for much longer, some as long as two years. Most of these have resolved with the S&P moving higher.
In the charts below, the current trading range is highlighted in green and transposed on prior periods that are largely similar. All of the green boxes are the exact same size.
Starting with the current bull market, the current trading range is almost identical to the one that lasted from January until August 2011. That one ended badly.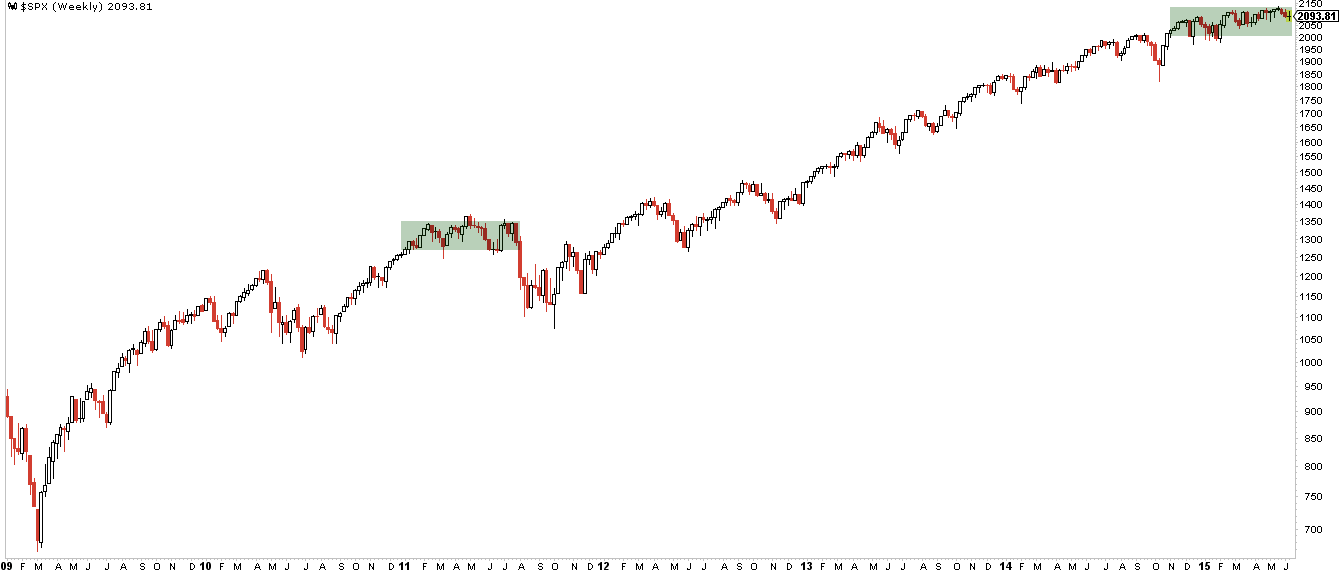
The 2004-07 bull market had at least three similar periods. In fact, they lasted almost a year each. It was a very tedious bull market.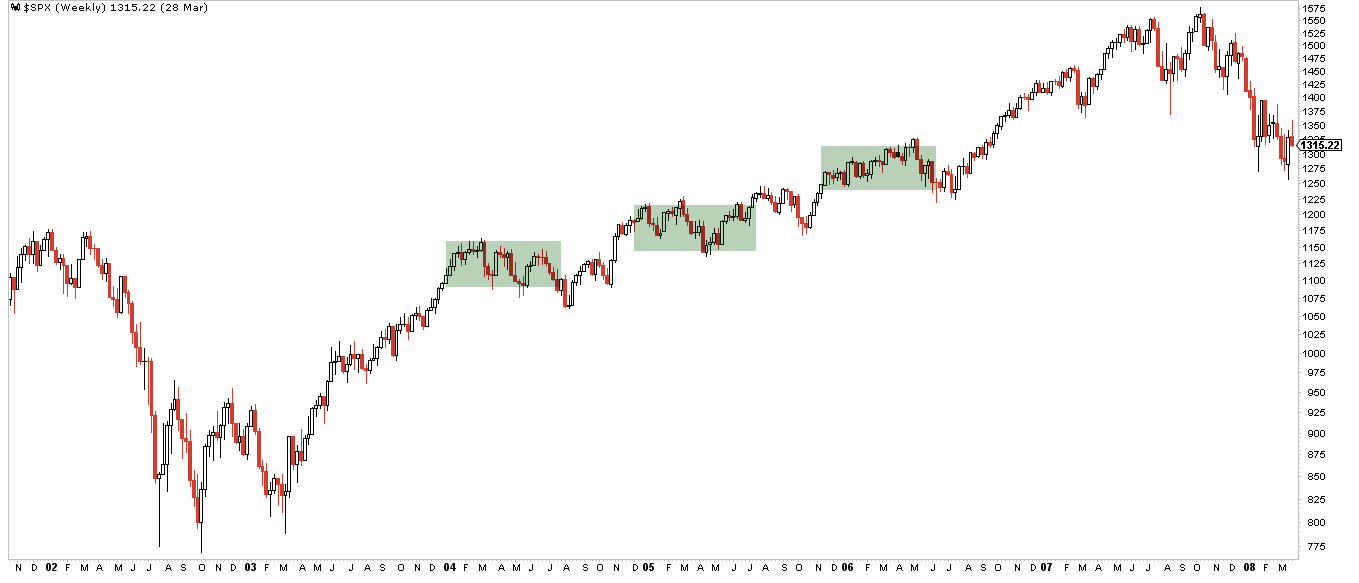
The first four years of the vaunted 1990s bull market weren't any different. In fact, the S&P was virtually unchanged from early 1993 until the end of 1994, something to think about if you consider the current trading range to be of excessive length.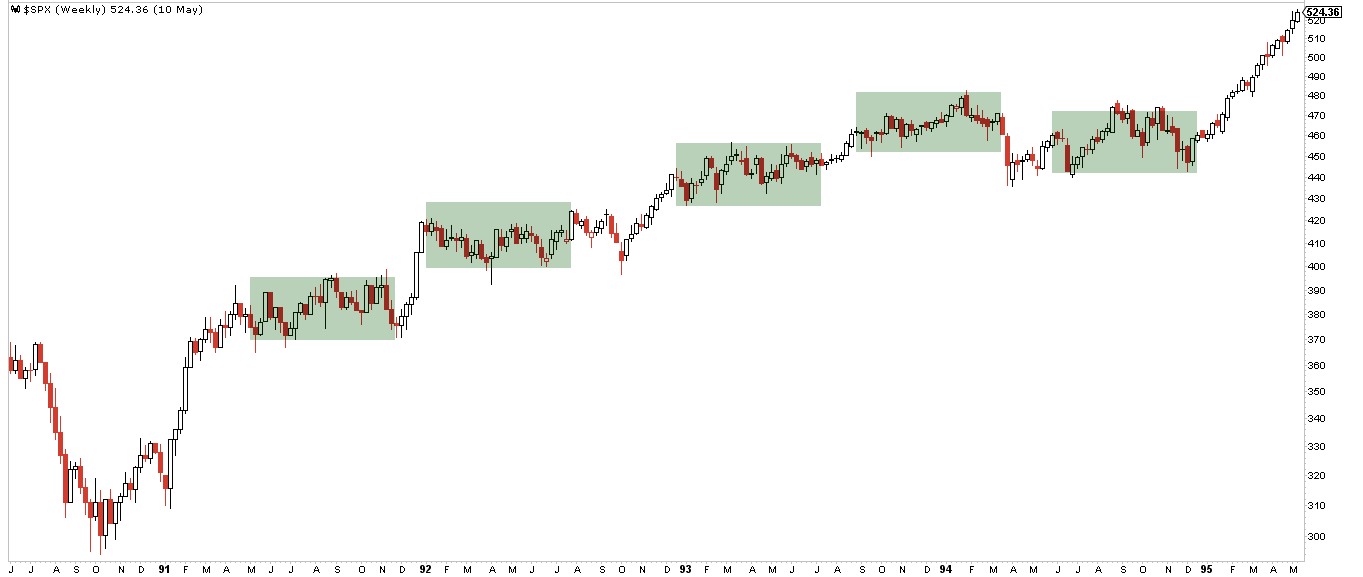
The second half of the 1990s saw bigger gains. But between massive runs higher, there were long periods of consolidation in 1996, 1997 and 1999 (and a 20% correction in 1998).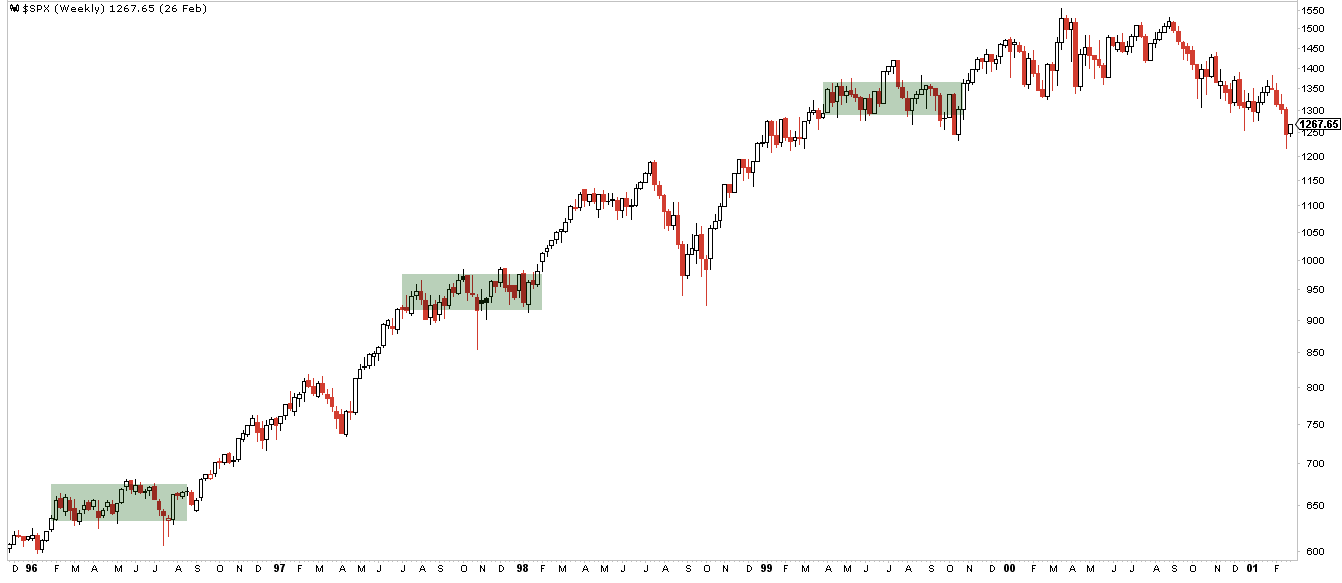
The 1980s bull market was the same. There was almost no gain from early 1983 until early 1985. After a run higher, March to December 1986 was net flat. The same is true for most of 1988. And for the year long period from mid-1989 to mid-1990.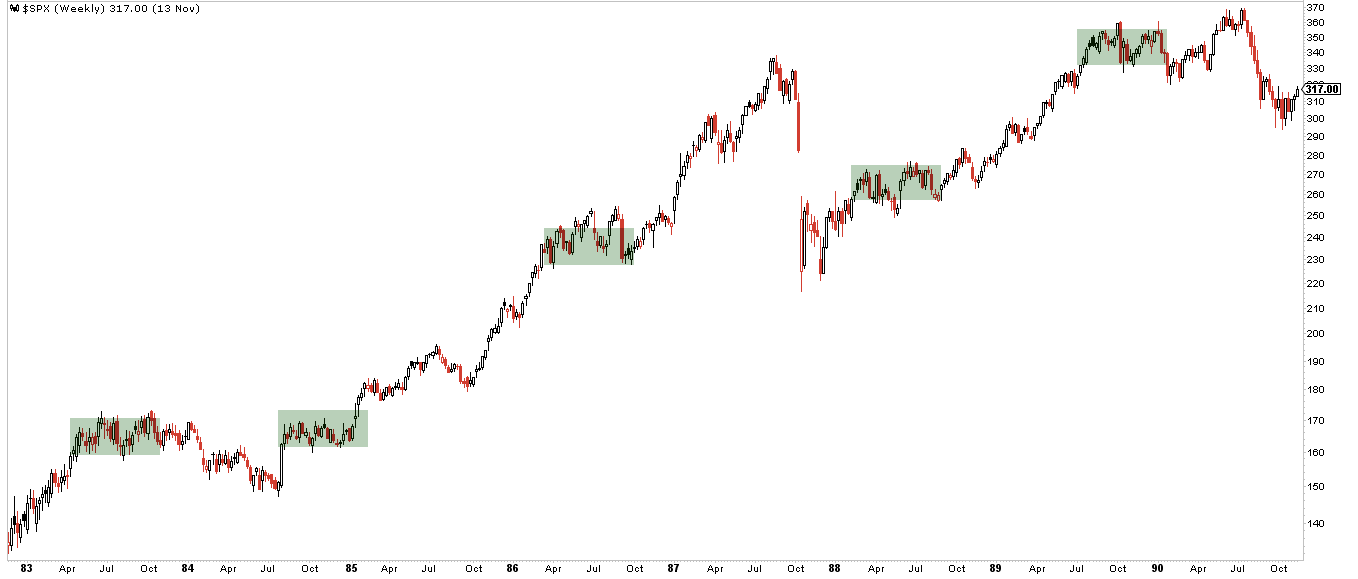
Long periods where the S&P trades sideways in a range are not unusual. There have been at least 15 similar situations in the past 35 years, about one every two years. Some of these have lasted as long as two years. Most of these have resolved with the S&P moving higher. We've been in a trading range for 7 months; settle in, this could go on much longer.
- English (UK)
- English (India)
- English (Canada)
- English (Australia)
- English (South Africa)
- English (Philippines)
- English (Nigeria)
- Deutsch
- Español (España)
- Español (México)
- Français
- Italiano
- Nederlands
- Português (Portugal)
- Polski
- Português (Brasil)
- Русский
- Türkçe
- العربية
- Ελληνικά
- Svenska
- Suomi
- עברית
- 日本語
- 한국어
- 简体中文
- 繁體中文
- Bahasa Indonesia
- Bahasa Melayu
- ไทย
- Tiếng Việt
- हिंदी
S&P 500: Current Sideways Trading Could Go On Much Longer
Published 06/14/2015, 12:18 AM
Updated 07/09/2023, 06:31 AM
S&P 500: Current Sideways Trading Could Go On Much Longer
3rd party Ad. Not an offer or recommendation by Investing.com. See disclosure here or
remove ads
.
Latest comments
Install Our App
Risk Disclosure: Trading in financial instruments and/or cryptocurrencies involves high risks including the risk of losing some, or all, of your investment amount, and may not be suitable for all investors. Prices of cryptocurrencies are extremely volatile and may be affected by external factors such as financial, regulatory or political events. Trading on margin increases the financial risks.
Before deciding to trade in financial instrument or cryptocurrencies you should be fully informed of the risks and costs associated with trading the financial markets, carefully consider your investment objectives, level of experience, and risk appetite, and seek professional advice where needed.
Fusion Media would like to remind you that the data contained in this website is not necessarily real-time nor accurate. The data and prices on the website are not necessarily provided by any market or exchange, but may be provided by market makers, and so prices may not be accurate and may differ from the actual price at any given market, meaning prices are indicative and not appropriate for trading purposes. Fusion Media and any provider of the data contained in this website will not accept liability for any loss or damage as a result of your trading, or your reliance on the information contained within this website.
It is prohibited to use, store, reproduce, display, modify, transmit or distribute the data contained in this website without the explicit prior written permission of Fusion Media and/or the data provider. All intellectual property rights are reserved by the providers and/or the exchange providing the data contained in this website.
Fusion Media may be compensated by the advertisers that appear on the website, based on your interaction with the advertisements or advertisers.
© 2007-2024 - Fusion Media Limited. All Rights Reserved.
