The models developed by ExMetrix predict further growth in prices of copper. The platform generated two predictive models. The first one concerns the prices of copper and the second one refers to changes in value of copper. The conclusions out of both models are coherent – the copper market foresees a boom that may last at least several next months.
The evaluation of raw materials prices for a year or a few months forward is not inconsequential. The case of the copper market is not a unique incident. It is still a challenge for highly specialised research groups such as International Copper Study Group who are often forced to change radically their initial calculations. For example, in October 2014 ICSG computed that the copper deficit will amount to 270 thousand of tones in 2014. In the April assessment of 2016 it was expected over-production of copper up to 400 thousand of tones. ICSG justified the deficit as a result of late opening of new mines and they also pointed out problems with production in existing mines. The final deficit in 2014 was up to 410 thousand of tones. Referring back to the assessment form October 2014, according to ICSG the over-production of copper was expected to amount to 390 thousand of tonnes in 2015. Meanwhile the actual deficit totalled 57 thousand of tones. ICSG in their latest assessment (the end of October 2016) for 2017 they predict the over-production of 160 thousand of tones. In March 2016 they registered 20 thousand ton surplus. For several years now, the demand surprises researchers that it turns out to be bigger than expected.
In addition, ICGS reported that data on inventories in Chinese bonded warehouses may be distorted due to the lack of official statistics. Owing to the fact that about 40% of the global copper demand is generated in China the condition of the economy in this country largely determines the price of this metal.
In the Chinese energy sector is the highest demand for copper, which accounts for about 46% of the demand. The next are the household appliances sector 15%, transport 11%, the construction sector 9.5%, electronics 7.5%, and other categories which account for about 11%. Besides the copper in China is often used as dollar loan guarantees. In addition, China's State Reserves Bureau (SRB) does not hesitate to buy up large amounts of copper (thus affecting the exchange rate) to achieve and maintain stocks at around 2 million tones.
Over the longer period of time the demand for copper in China should be fostered by investments in the sector of renewable energy and reinforced by the need of reduction of pollution in big cities. The production of energy on wind farms is rapidly increasing in China. Most of this energy is generated outside the cities hence the demand for copper (power cables).
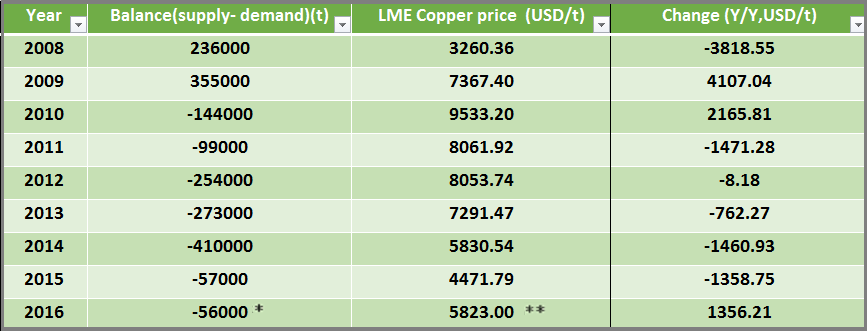
The latest data on balance of the refined copper against the copper rate and the rate changes in the years 2008-2016 are presented in the table below. Therefore, it can be concluded that that there is no simple translation of demand and supply level into the copper rate. The demand and supply do not explain satisfactorily the rate. The table shows that there is constant deficit since 2010 (the demand exceeds supply). Nevertheless, from 2011 to 2015 the rate was dropping. Instead, in 2010 it climbed and there are indications that 2016 will bring the same results.

(*) - assessment by ICSG (**) - LME rate from 09.12.2016
However, the data mentioned which could be implemented in building an accurate model explaining the changes in the copper rate is insufficient. On the other hand, future estimates are highly uncertain that implementing them to the model raises very serious questions. The attempt to build a predictive model of the copper rate in the perspective of five months required the use of additional data such as:
the volume of production of copper power cables, bars, pipes, metals, various types of electronic devices, cars and other non-ferrous metals
PPI and the employment rate in the production of non-ferrous metals and the mining industry of non-ferrous metals
sea and railway freight rates and employment rate in these areas
China’s import and export of refined copper
non-ferrous metal prices, ore reserves and refined copper
economic situation in the sector of energy (renewable energy), construction, automotive and real estate market
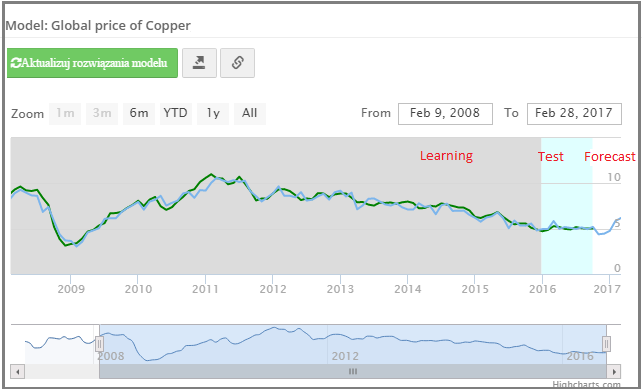
The model was developed in two independent versions as a forecast of the course itself and the forecast of five-months copper rate changes (momentums). The versions are coherent, that is, both models point in the same direction of change (growth) rate. The model was made in October 2016 on data to 30.09.2016. The end of the forecast is the end of February 2017. The line chart below presents the results of the model in the version prepared for the rate.

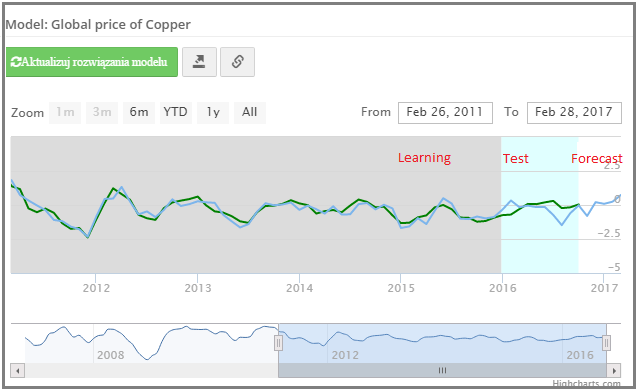
The next line graph shows the results of the model in a version developed for five months rate changes.

In both models was used the so-called Janus factor. Its value in both cases is less than 1, indicating that the mean square error in the test interval is not greater than the optimization interval of the structural parameters of models. This allows to consider both models up to date and it allows for their use.
