State Street has had a tremendous advantage in the exchange-traded fund world by being the first issuer of dedicated sector funds. Their highly successful SPDR sector series debuted in 1998 and has spent nearly two decades building a world-class reputation. Everyone from professional to novice investors respect SPDR ETFs for their liquidity, transparency, low-costs, and tax efficiency.
The original suite of 9 sector funds is built on the Standard & Poor’s Global Industry Classification Standard. This is published by a panel of experts to clearly delineate each company within the S&P 500 Index into individual categories based on their business practices. The end result is a diversified pool of large-cap stocks within each group that offer a range of competing products and services.
This article will be the first in a series dedicated to peeling back the onion that is each major SPDR sector ETF. The goal of this process is to understand how each of these funds is constructed and the nuances in their field. In addition, I will be comparing these benchmarks against other competing ETFs to see how they stack up in terms of index construction, performance, fees, and other key metrics.
Technology Select Sector SPDR (N:XLK)
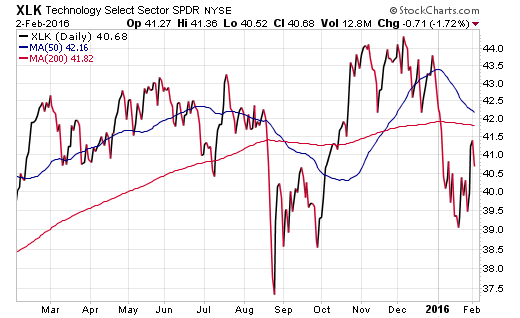
There are many titans within the technology world. Apple Inc (O:AAPL) owns smart phones, Alphabet Inc (GOOGL) owns search, and Facebook Inc (O:FB) owns social media. Bringing all of these juggernauts and more together in one package is the well-known Technology Select Sector SPDR (XLK). This ETF has been a dominant force in the technology world during its entire 17-year existence and continues that tradition today as the largest ETF in its category.
XLK is made up of 75 large-cap companies engaged in the production of software, hardware, social media, internet services, telecommunication, and other electronic devices. In addition to the three household names mentioned above, it contains significant exposure to Microsoft Corp (O:MSFT) and AT&T Inc (N:T) in its top five holdings.
The index construction of the fund is distributed in a market capitalization style methodology that gives the largest companies the greatest share of overall invested capital. To put that in perspective, the top five companies represent 47.63% of the total XLK portfolio. The number one company is AAPL, which makes up 13.43% of the fund.

This technology benchmark has over $12 billion in total assets, which makes it the third largest major sector SPDR by overall size. In addition, it charges a reasonable expense ratio of 0.14%, which is the standard across the entire suite of 9 major sectors in the State Street lineup.
From a liquidity standpoint, XLK has posted average daily trading volume of over 10 million shares per day over the last year. That’s the equivalent of greater than $400 million in notional value trading hands every single trading day. This makes XLK a deep pool of reserves for buyers and sellers to execute their transactions in an orderly and efficient manner.
The closest competition in terms of overall size, costs, and objectives to XLK is the Vanguard Information Technology (N:VGT). This similar style fund has grown to over $8 billion in total assets and charges an expense ratio of just 0.10%. In terms of structure, VGT takes a broader view by expanding its technology scope to include a wider array of smaller companies. There are currently 386 holdings in this variant fund, but surprisingly the differing index characteristics hasn’t led to a significant divergence in performance.
Over the last 5 and 10-year time frames, XLK has generated annualized returns of 13.18% and 9.01% respectively through December 31, 2015. During those same periods, VGT has generated annualized gains of 13.22% and 9.29%. In this instance, the performance of both funds has been primarily driven by their large allocations in similar top holdings rather than an emphasis on costs or other factors.
The Bottom Line
Investing in technology stocks is often a hit or miss proposition that is fraught with individual business risks unique to each endeavor. Owning a diversified technology sector fund such as XLK allows you to participate in the technology theme across a number of industry groups.
Nevertheless, it should be noted that sector ETFs can be more volatile than a broad benchmark such as the SPDR S&P 500 ETF (N:SPY) and may not be suitable for all types of investors. It’s important to fully understand the makeup of these vehicles and how they fit within the context of your specific portfolio prior to adding them to your investment mix.
