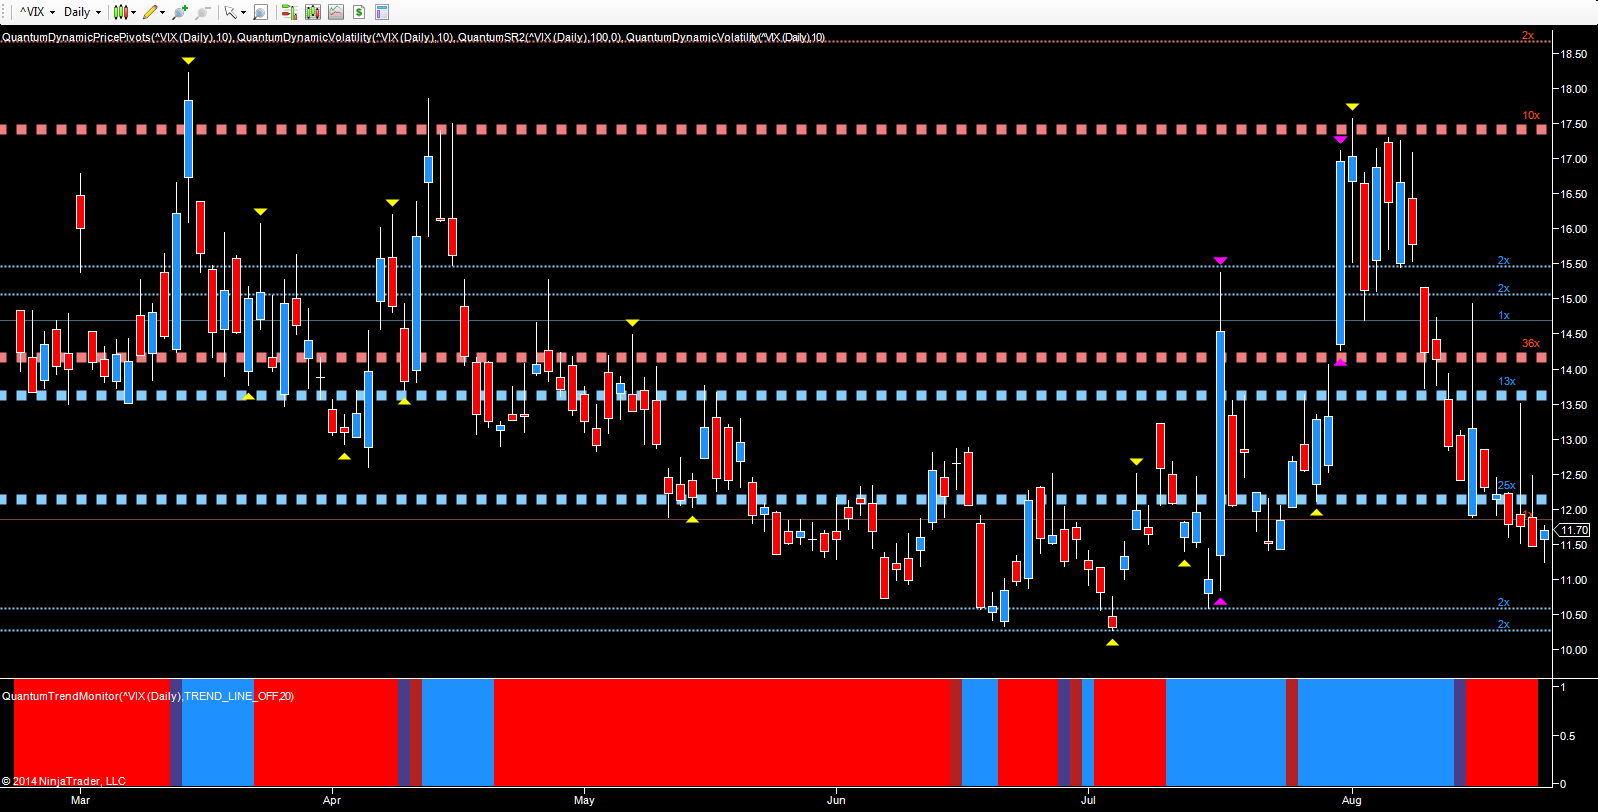
As US equity markets continue to climb the wall of worry following last week’s FOMC minutes, it’s time to revisit the daily chart for the VIX once again, for an alternative and perhaps more considered view on the current bullish trend. The spike higher in early August was the trigger for the soothsayers and doom mongers to re-emerge from the undergrowth, all suggesting that this was the major reversal, markets were overbought and could go no higher, and the big short was about to start. I was not one of them, and indeed in my analysis written at the time, suggested this was nothing more than a minor correction, which indeed proved to be the case. As a volume price analysis trader, it is not difficult to interpret what the charts are saying, and provided they are read from the perspective of the market makers and institutional players, then the price action is as clear as day. Indeed, what is abundantly clear from the last few weeks is that we have yet to reach a selling climax ( for the insiders ) in any timeframe, and until we do, then the market will continue higher. Rest assured you will read about the big short here first!
And so to the VIX, the market’s barometer of fear, and as confidence grows so the VIX declines and vice versa. In fact, digressing for a moment, it is one of the few measure of volatility which provide a directional bias. Volatility by its nature is non directional, as it is a measure of sudden and extreme price action which compress both time and price. The VIX is therefore unique in the sense that, as a measure of volatility, it also reflects market direction.
The technical picture for the VIX remains bearish, and following the sharp spike higher in early August, this duly ran into the deep level of resistance in the 17.50 area, which was followed a short period of congestion, the VIX then reversed lower once again, initially through potential support in the 14.25 and 13.75 region, before moving lower still and through yet another platform of potential support in the 12.10 area. This too has now been breached with the index closing Monday’s trading session at 11.70 on the back of a relatively quiet trading session. As the index now looks to push ever deeper into the current congestion zone, the index looks set to test the floor of support in the 10.20 to 10.40 area, and if this is broken then single figures for the VIX look set to be hit, at which point the panic alarms really will start ringing. But then as I always say, markets and instruments can stay over bought or over sold for long periods of time, and as the late, great Jesse Livermore once said, ‘stocks are never too high for you to begin buying, and never too low for you to begin selling’ ..and the only caveat I would add, is that volume will validate this view. In other words if you are buying, make sure it’s not when the market makers are selling (distributing), and don’t sell when they are accumulating, which volume price analysis will, of course, reveal!
