I’m going to be taking a careful look at bonds today but first I’ll look at the position of the S&P 500 Large Cap Index (SPX) after Tuesday’s retest of broken triangle support.
On the SPX daily chart we saw a bounce to test the daily middle Bollinger Band® and then a reversal to retest the broken rising wedge resistance trendline from 2011 that has been holding as support this week. It’s worth noting that Tuesday’s low was only four points above the daily lower Bollinger Band so I’m counting that as a technical hit and we could well see a bounce from that hit of a key technical support level. SPX daily chart: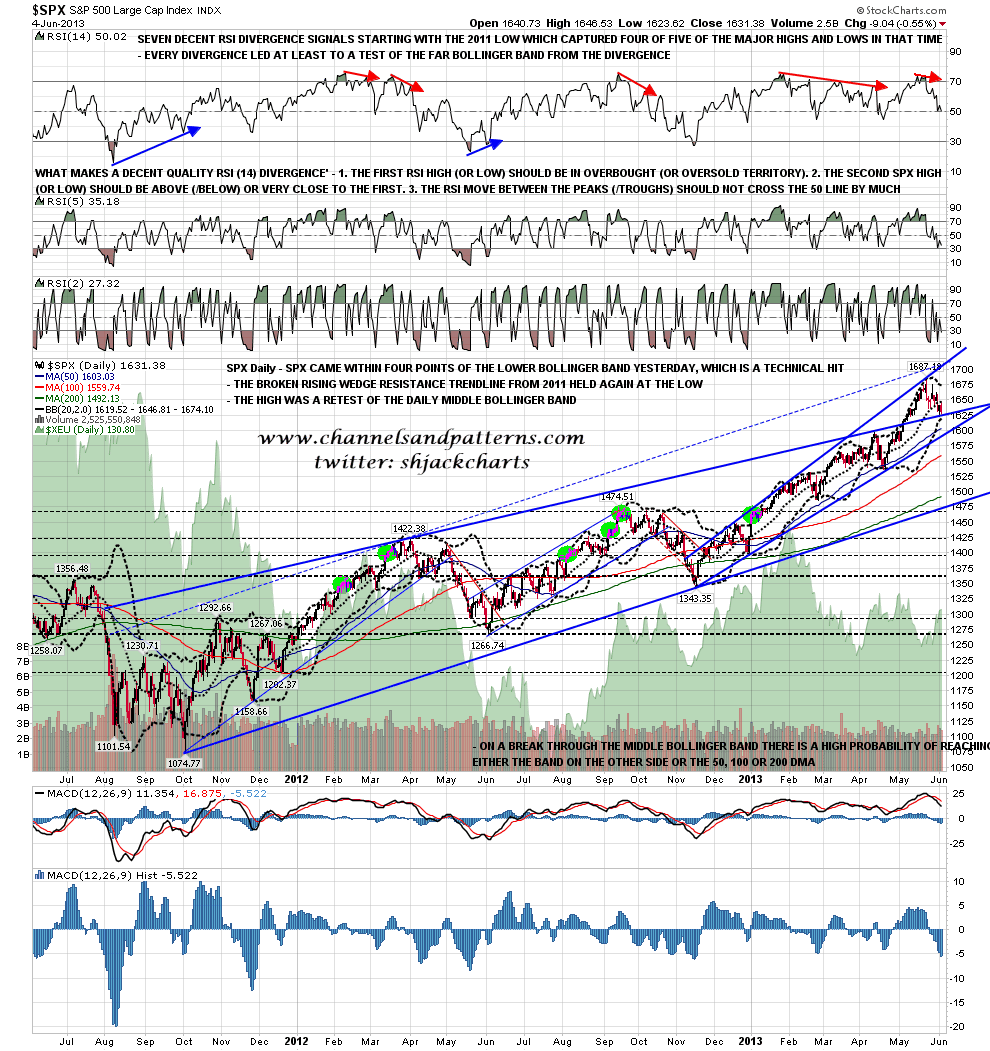
On the seven month SPX 60min chart of the broadening ascending wedge from November there is currently a falling wedge in play from the high. If we see a break below this week’s low at 1622.72 then I’d expect a fast move to test broadening wedge support in the 1595 area. Otherwise we could see that falling wedge break up. SPX 60min chart: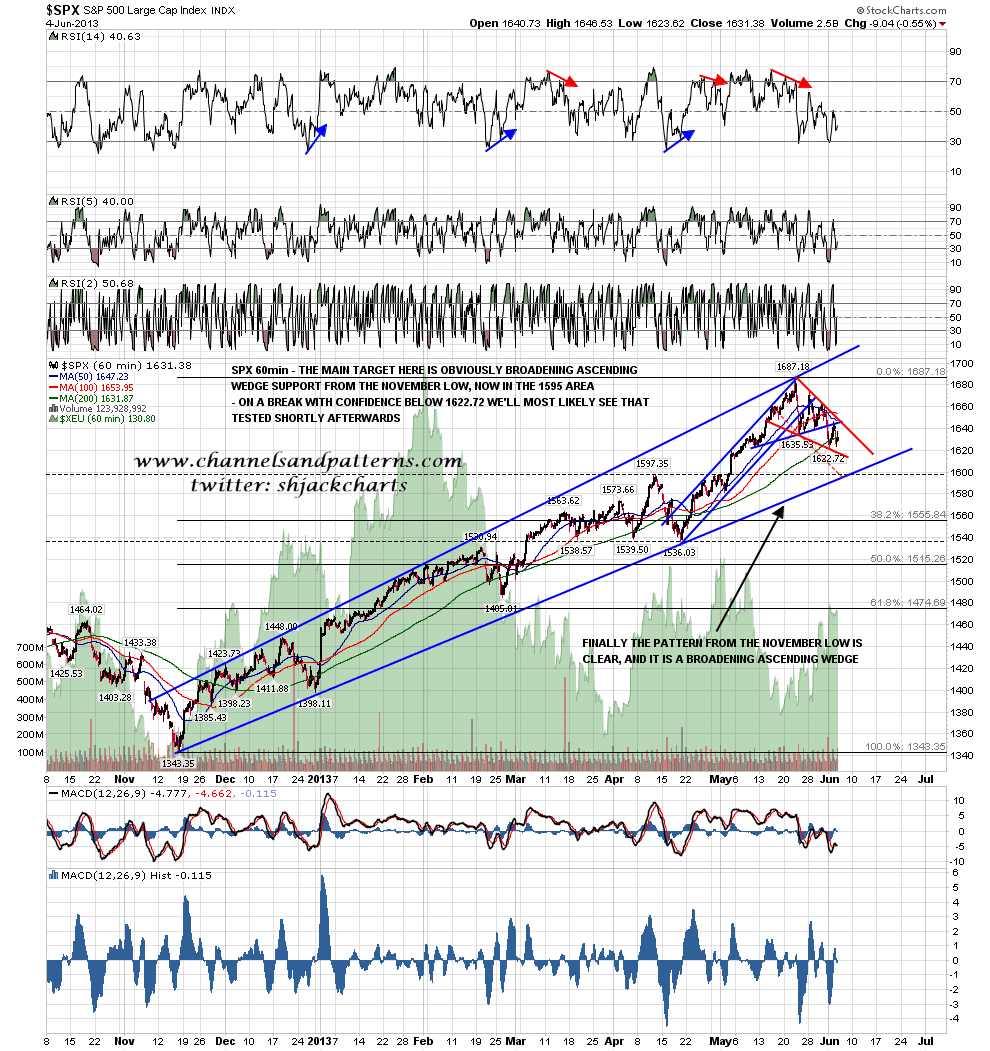
Looking at the SPX 15min chart the high Tuesday was a retest of broken triangle support, but it has also set up a possible double-bottom. On a break with any confidence below 1622.72 I’d expect a move to test the 1595 area, but if we see a bounce and then a break above both Tuesday’s high at 1646.53 and declining resistance from the high in the same area then I would have a double-bottom target in the 1670 area and we could well then see a test of the highs. SPX 15min chart: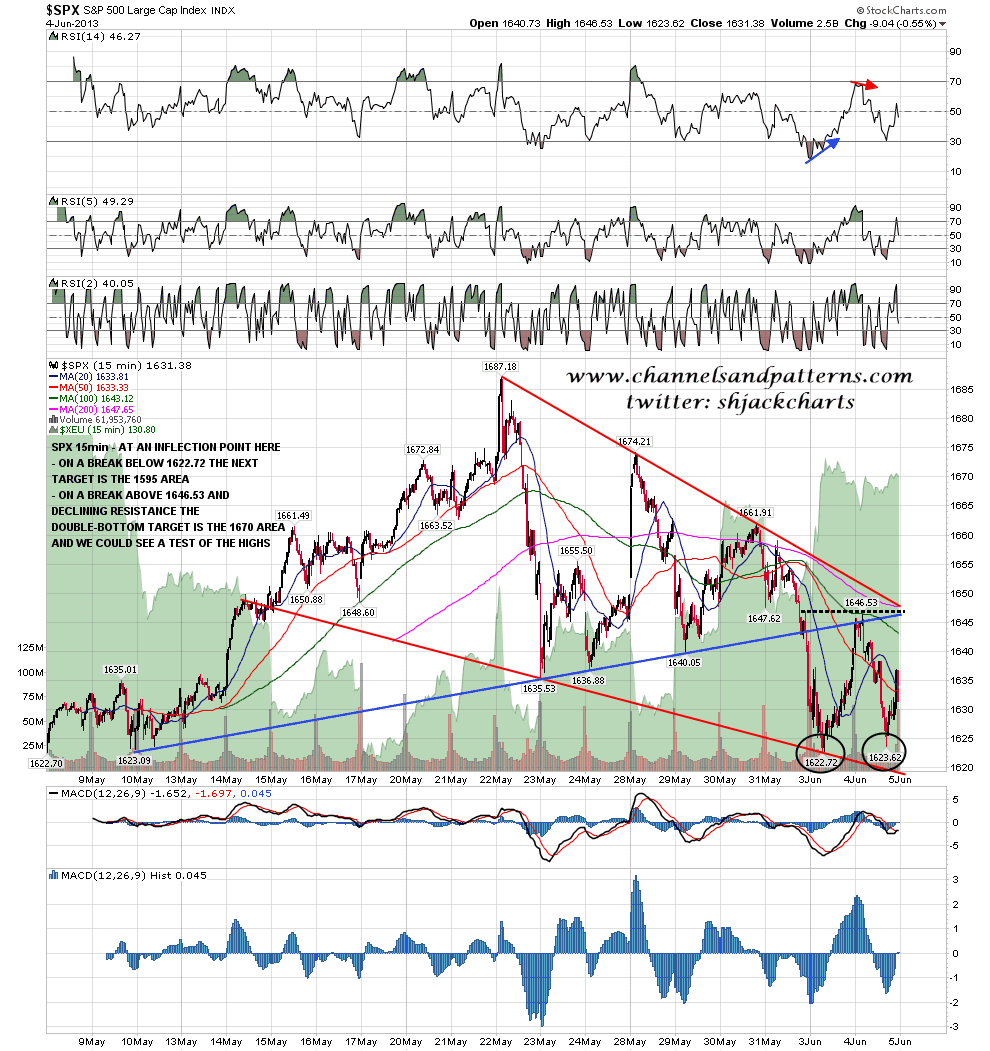
Which of these two scenarios will win out? We’ll have to see, but the pattern setups on Dow and TRAN have me leaning towards a downside resolution.
On forex I still can’t see any obvious sign of reversal back down on GBP/USD, but EUR/USD is showing marked negative divergence on the 4hr chart and has formed a rising wedge from the last low, so we may see that reversal soon. On CL I have a rough IHS and I’m watching to see whether CL can break over declining resistance in the 94.5 area. If we see that I have an IHS target just over 96 and we may well see a retest of the recent highs.
On to bonds, where I want to explain in more detail what I am seeing there. I posted a chart in March with a forecast path for the iShares Barclays 20+ Year Treasurey Bond Fund (TLT) over the next few months, and apart from an overshoot on the upside in April, TLT has since followed my forecast path pretty closely so far.
Here’s the updated version of that TLT daily chart: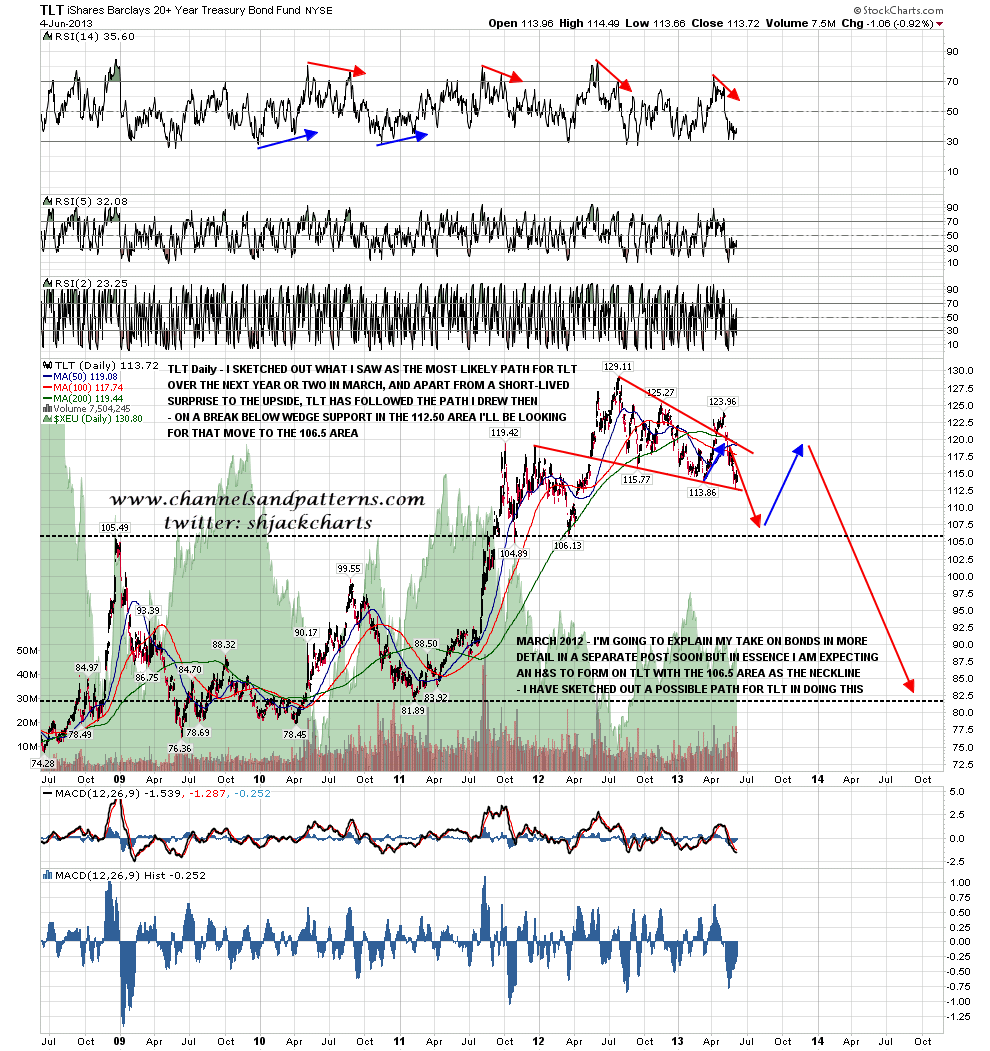
When I posted that chart I promised a detailed post to follow to explain where I think the bond market is in the big picture and this is that post.
Looking closer at the TLT chart, TLT has now hit for the fourth time the falling wedge support trendline on the first chart and that pattern still needs to be borne in mind, though the April overshoot may have been that pattern breaking up and failing to make target. In the event however that the overshoot was a bearish wedge overthrow before a break downwards, I should mention that the wedge target would be in the 97% area, though with only a 30% chance of making that target.
My main target on a break down from here would be the very strong established support level and possible H&S neckline in the 106.5 area. TLT daily chart: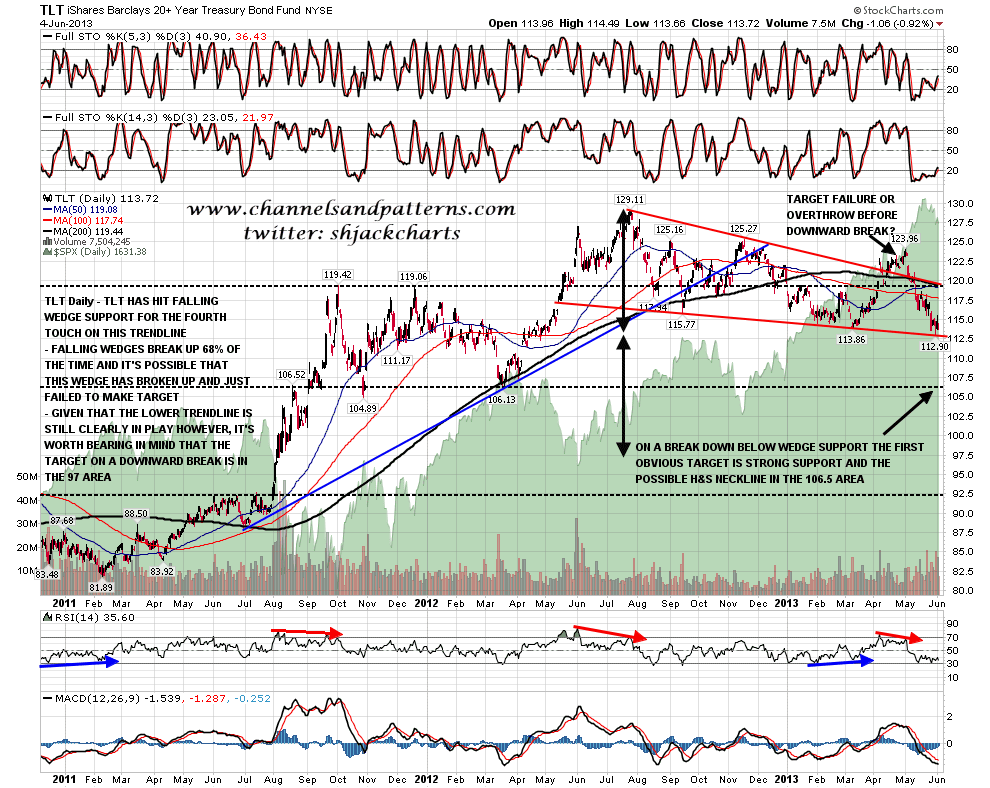
Why have I been looking for a large H&S to form on TLT? Well that’s because of the longer term Treasury charts. Last summer I posted the amazing 27 year declining channel on TYX (30yr Treasury Yields). That channel is now an amazing 28yr channel of course. I have left the text on that chart unchanged from my comments then, and you can see that I was looking at the possibility that the second low of a major double-bottom had just been made, with the suggestion that if that was the case, then we would most likely see TYX move back towards a possible IHS neckline in the 35 (3.5%) area.
TYX closed just under 33 Tuesday, so that move has now largely taken place. The TLT H&S that I have been considering is of course the mirror image of this pattern on TYX. TYX monthly chart: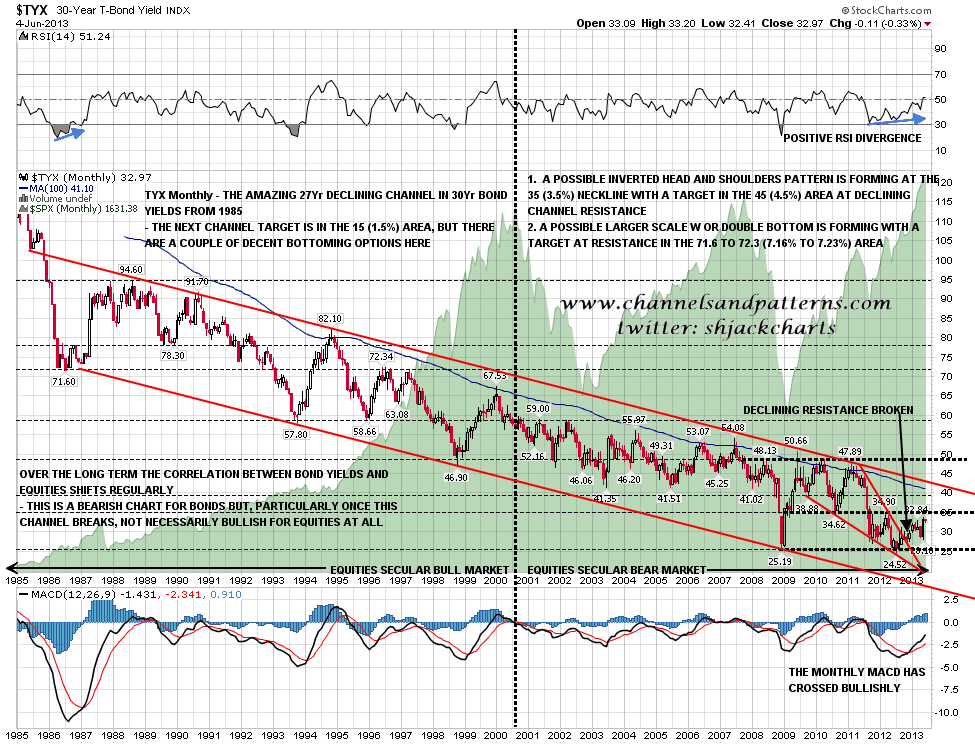
Why was I looking at that possible double-bottom forming on the TYX chart? The reason was that obviously the 2008 low was major support, but I was also watching major levels being hit on the TNX (10yr Treasury Yield) and USB (10yr Treasuries) charts.
I’ll show that on the LOG scale USB monthly chart below and you can see that a rising wedge has been forming there since 1987. USB hit wedge resistance at the same time that TYX tested the 2008 low, and there was an obvious reversal level there. You can see the same possible H&S forming on USB as on TLT, and so I’m looking for a move to the possible H&S neckline in the 135 area. The next major trendline target on USB is wedge support in the 125 area of course and if an H&S doesn’t form then that would be the next obvious target after 135. If that rising wedge breaks down then that would suggest that the long bull market on bonds since 1981 is over, though I’d be waiting for a break up from the 28yr declining channel on TYX for final confirmation. USB monthly (LOG) chart: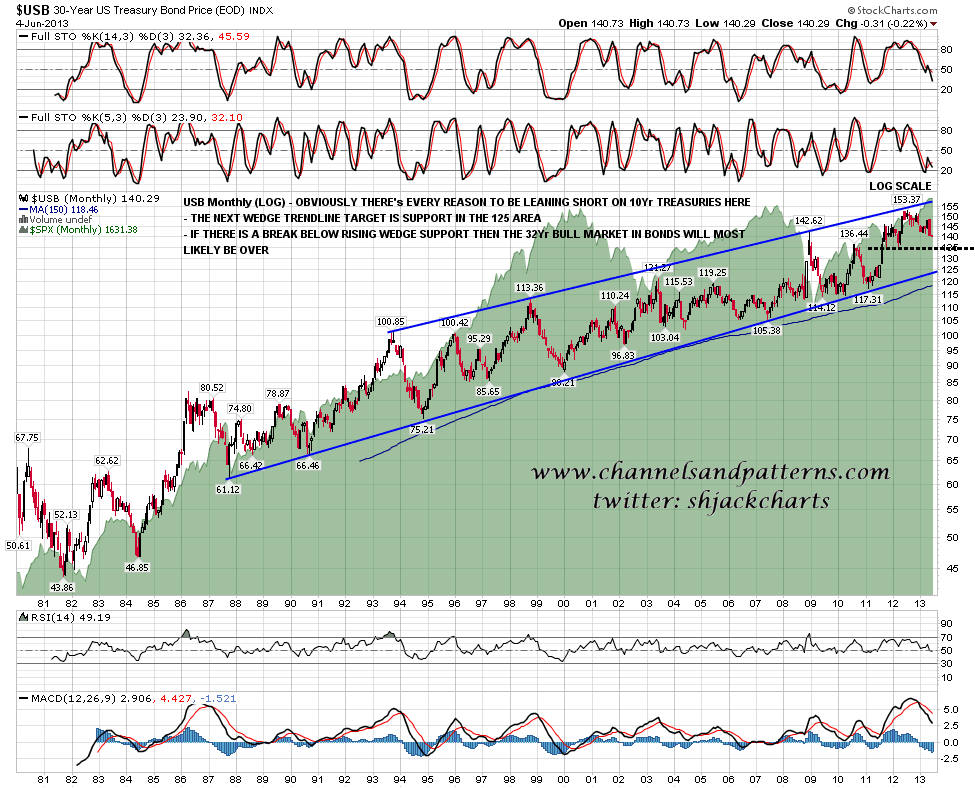
ES has been testing Tuesday’s lows overnight and they’ve held so far. The key levels on SPX are the 1622 low and Tuesday’s high at 1646. A conviction break of either should be respected.
- English (UK)
- English (India)
- English (Canada)
- English (Australia)
- English (South Africa)
- English (Philippines)
- English (Nigeria)
- Deutsch
- Español (España)
- Español (México)
- Français
- Italiano
- Nederlands
- Português (Portugal)
- Polski
- Português (Brasil)
- Русский
- Türkçe
- العربية
- Ελληνικά
- Svenska
- Suomi
- עברית
- 日本語
- 한국어
- 简体中文
- 繁體中文
- Bahasa Indonesia
- Bahasa Melayu
- ไทย
- Tiếng Việt
- हिंदी
The Big Picture For Bonds
Published 06/06/2013, 12:28 AM
Updated 07/09/2023, 06:31 AM
The Big Picture For Bonds
Latest comments
Loading next article…
Install Our App
Risk Disclosure: Trading in financial instruments and/or cryptocurrencies involves high risks including the risk of losing some, or all, of your investment amount, and may not be suitable for all investors. Prices of cryptocurrencies are extremely volatile and may be affected by external factors such as financial, regulatory or political events. Trading on margin increases the financial risks.
Before deciding to trade in financial instrument or cryptocurrencies you should be fully informed of the risks and costs associated with trading the financial markets, carefully consider your investment objectives, level of experience, and risk appetite, and seek professional advice where needed.
Fusion Media would like to remind you that the data contained in this website is not necessarily real-time nor accurate. The data and prices on the website are not necessarily provided by any market or exchange, but may be provided by market makers, and so prices may not be accurate and may differ from the actual price at any given market, meaning prices are indicative and not appropriate for trading purposes. Fusion Media and any provider of the data contained in this website will not accept liability for any loss or damage as a result of your trading, or your reliance on the information contained within this website.
It is prohibited to use, store, reproduce, display, modify, transmit or distribute the data contained in this website without the explicit prior written permission of Fusion Media and/or the data provider. All intellectual property rights are reserved by the providers and/or the exchange providing the data contained in this website.
Fusion Media may be compensated by the advertisers that appear on the website, based on your interaction with the advertisements or advertisers.
© 2007-2024 - Fusion Media Limited. All Rights Reserved.
