In the September 14 issue of The Wagner Daily trading newsletter, we said, “The market rally continues to pick up steam with more groups participating in the advance. The financial sector has picked up some momentum the past few weeks, with the S&P Select Financial SPDR ETF (XLF) breaking out from a six-month base on Thursday (September 13).” Today, we follow-up that analysis by examining in more detail the increasing bullish momentum in the financial sector.
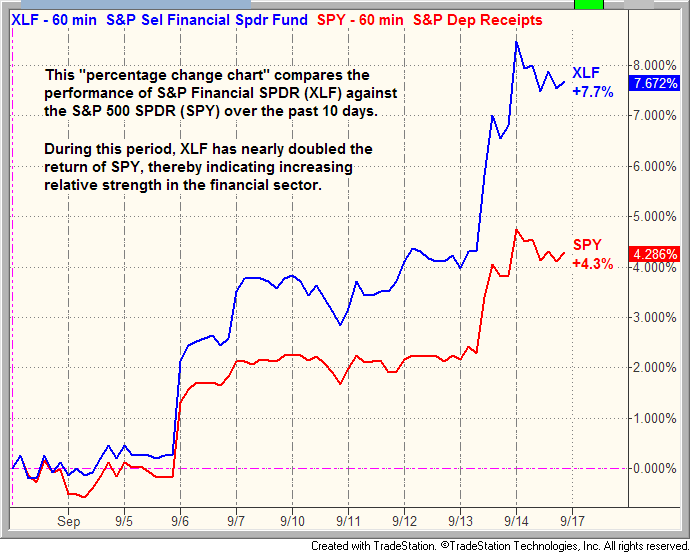
In addition to scanning hundreds of daily ETF chart patterns every night, we also use percentage change charts to compare the performance of numerous industry sectors with the benchmark S&P 500 and/or Nasdaq Composite indices. Rather than showing actual price changes, percentage change charts simply compare relative price performance between two or more indexes, ETFs, or stocks. The increasing bullish momentum in the financial ETF we mentioned last Friday can be easily seen on the percentage change chart below, which compares the performance of S&P Select Financial SPDR (XLF) against the S&P 500 SPDR (SPY), a popular ETF proxy that tracks the performance of the broad-based S&P 500 Index:
On the chart above, notice that XLF started showing slight relative strength to SPY on September 4, but the bullish divergence started became much more clear starting on September 6. Since then, the relative strength of XLF has been increasing, which tells us institutional funds are rotating back into the financial arena. As such, the gain of XLF (7.7%) has nearly doubled the return of SPY (4.3%) over the past 10 days.
Although following the flow of institutional funds from one industry sector to another is a key aspect of our ETF sector trading strategy, it’s important to realize there are typically at least several different ETFs that track the same sector. Therefore, upon identifying relative strength within a particular sector, the next step is to analyze each of the various ETF fund families to see which individual ETF is showing the most relative strength within the sector index. This is necessary because the daily and weekly chart patterns of various ETF families can vary greatly, depending on the underlying stock portfolio that comprises each ETF.
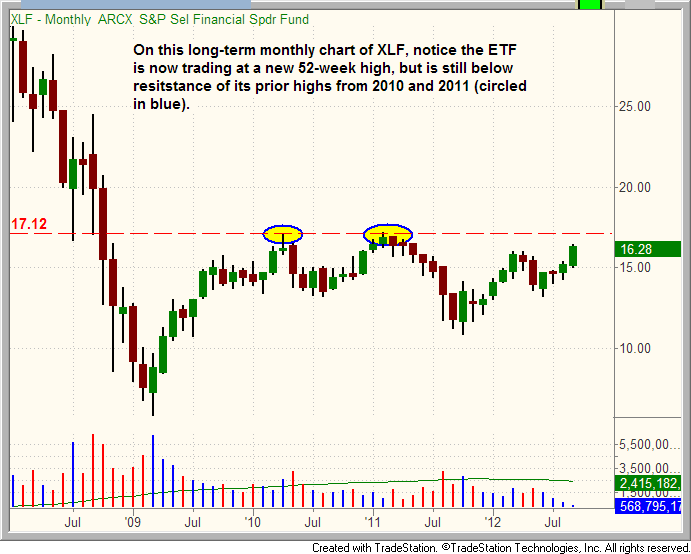
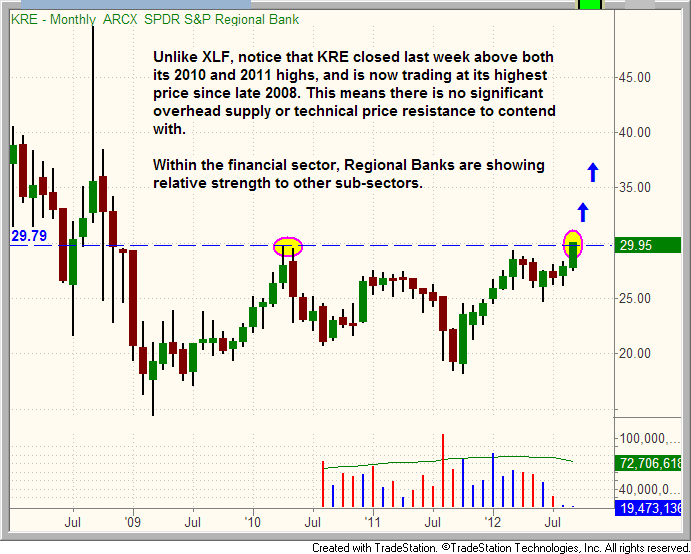
Upon analyzing the charts of quite a few financial ETFs over the weekend, we determined the most relative strength is currently within the Regional Banks sub-sector. Specifically, one of the best ETFs for trading in the financials right now may be S&P Regional Bank SPDR (KRE). Although the more-diversified XLF closed at a new 52-high last week, it is still trading below resistance of its 2010 and 2011 highs. Conversely, KRE has already broken out above its 2010 and 2011 highs, and is trading at its highest price since late 2008. The relative strength of KRE vs. XLF is shown on the long-term monthly chart patterns of XLF and KRE below: 

Although our exact entry and exit prices are typically determined from the shorter-term daily chart patterns, the longer-term weekly and monthly chart patterns are important because they show us the “big picture” of the trend. Being on the right side of that trend increases our odds of a successful trade, even if we are only buying the ETF for a short-term, momentum-based swing trade.
Due to its relative strength and lack of significant overhead price resistance (most investors who wanted out of this ETF are already out by now), we now like KRE for potential swing trading buy entry on a pullback. It has much less overhead supply than XLF, and other financial ETFs we compared as well. Along with a few other select ETFs with relative strength, we are now monitoring KRE for buy entry when it retraces to provide a positive reward-risk ratio. Exact entry and exit prices will be provided to Wagner Daily subscribers in the ETF Trading Watchlist when/if it meets our criteria for entry.
Our sole open ETF position, ProShares Ultra Russell 2000 ETF (UWM) came within just 2 cents of our original target price last Friday, before drifting a bit lower into the close. But because the ETF came within such close proximity of our price target, and since UWM is now showing an unrealized gain of 10% since our September 5 buy entry, subscribers should note we will be selling UWM at market on Monday’s open to lock in a nice gain on this swing trade.
Given last week’s substantial broad market gains, it would not be surprising for stocks to pull back from their highs, or at least enter a period of sideways consolidation in the coming week. Frankly, we would like to see that happen, as there is currently a lack of new ETF trade setups with low-risk entry points at current levels. On the other hand, we are continuing to build an increasing list of ETFs with relative strength that we are targeting for potential swing trade entry when the market eventually enters into at least a short-term correction by price or time. As always, patience to wait for proper trade entry points with favorable reward-risk ratios is important, so we are not interested in chasing ETFs just for the sake of action. Nevertheless, we will be “locked and loaded” with new ETF trading setups when stocks eventually pull back or start consolidating after their recent gains.
Original post
- English (UK)
- English (India)
- English (Canada)
- English (Australia)
- English (South Africa)
- English (Philippines)
- English (Nigeria)
- Deutsch
- Español (España)
- Español (México)
- Français
- Italiano
- Nederlands
- Português (Portugal)
- Polski
- Português (Brasil)
- Русский
- Türkçe
- العربية
- Ελληνικά
- Svenska
- Suomi
- עברית
- 日本語
- 한국어
- 简体中文
- 繁體中文
- Bahasa Indonesia
- Bahasa Melayu
- ไทย
- Tiếng Việt
- हिंदी
The Best Financial ETF For Short-Term Trading Now
Published 09/17/2012, 02:36 AM
Updated 07/09/2023, 06:31 AM
The Best Financial ETF For Short-Term Trading Now
3rd party Ad. Not an offer or recommendation by Investing.com. See disclosure here or
remove ads
.
Latest comments
Install Our App
Risk Disclosure: Trading in financial instruments and/or cryptocurrencies involves high risks including the risk of losing some, or all, of your investment amount, and may not be suitable for all investors. Prices of cryptocurrencies are extremely volatile and may be affected by external factors such as financial, regulatory or political events. Trading on margin increases the financial risks.
Before deciding to trade in financial instrument or cryptocurrencies you should be fully informed of the risks and costs associated with trading the financial markets, carefully consider your investment objectives, level of experience, and risk appetite, and seek professional advice where needed.
Fusion Media would like to remind you that the data contained in this website is not necessarily real-time nor accurate. The data and prices on the website are not necessarily provided by any market or exchange, but may be provided by market makers, and so prices may not be accurate and may differ from the actual price at any given market, meaning prices are indicative and not appropriate for trading purposes. Fusion Media and any provider of the data contained in this website will not accept liability for any loss or damage as a result of your trading, or your reliance on the information contained within this website.
It is prohibited to use, store, reproduce, display, modify, transmit or distribute the data contained in this website without the explicit prior written permission of Fusion Media and/or the data provider. All intellectual property rights are reserved by the providers and/or the exchange providing the data contained in this website.
Fusion Media may be compensated by the advertisers that appear on the website, based on your interaction with the advertisements or advertisers.
© 2007-2024 - Fusion Media Limited. All Rights Reserved.
