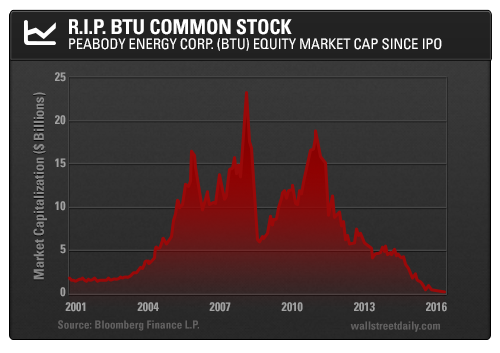
In May 2001, Peabody Energy Corp. (at the time trading as BTU) went public. Then, the company’s future looked so bright…
In the prior year, the coal that Peabody sold had fueled the generation of over 9% of all electricity in the United States. The company had 9.3 billion tons of proven and probable coal reserves. And China’s coal consumption was just about to soar, too.
Peabody even used the majority of the IPO proceeds to repay debt. Peabody’s equity shareholders were set to be handsomely rewarded – and they were. For a time anyway.
Peabody’s market cap surpassed $20 billion at one point. Unfortunately, Peabody’s common stock is effectively worthless today.

Like Lehman Brothers, which was the lead bookrunner on the company’s IPO, Peabody has now gone bust.
Peabody filed for Chapter 11 bankruptcy protection on April 13. Under the company’s plan of reorganization, it intends to:
“Reduce its overall debt level, lower fixed charges, improve operating cash flow, and position the company for long-term success.”
With the insolvency of Peabody, virtually the entire U.S. coal industry has now gone bankrupt. And there are plenty of other companies in the energy sector experiencing credit distress, too.
Default Cycle
Last week, Energy XXI Ltd. (NASDAQ:EXXI) also filed for bankruptcy protection. The crude oil exploration and production (E&P) company already has a tentative deal with bondholders that would eliminate more than $2.8 billion in debt from its balance sheet.
Then on Friday, Goodrich Petroleum Corp. (OTC:GDPM), a shale oil and natural gas E&P firm, filed for Chapter 11, as well.
The defaults I warned about in 2014 have arrived. There will be more, so let’s assess the magnitude of the problem.
All three of the aforementioned companies were losing money at the time of their bankruptcies.
More specifically, they all had negative earnings before interest, taxes, depreciation, and amortization (EBITDA) over the last 12 months.
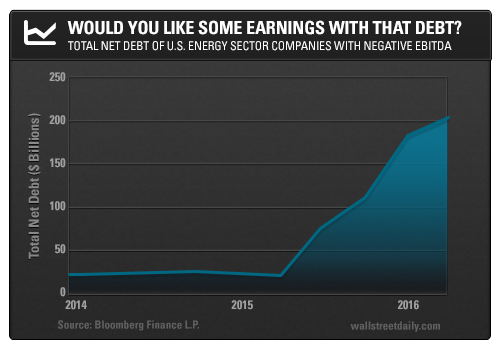
The chart below shows the progression of total net debt (debt minus cash) for U.S.-domiciled energy companies with negative EBITDA.

Astoundingly, there’s now over $200 billion in net debt on the balance sheets of energy companies that are losing money. Additionally, $172 billion – almost all of it – is from issuers who aren’t already in default.
This chart illustrates two key points…
- America’s energy renaissance has clearly been a credit-fueled boom.
- The decline in coal, crude oil, and natural gas prices now leaves a mountain of debt exposed to default.
Brace yourselves, because the energy bust has only just begun!
This is why it’s important to be wary of short squeezes. After all, both EXXI and BTU experienced rallies in excess of 200% less than a month before the companies filed for bankruptcy.
