
Monitoring purposes SPX: Long SPDR S&P 500 (ARCA:SPY) on 8/7/14 at 1909.57; stop 1930.
Monitoring purposes GOLD: Gold ETF SPDR Gold Trust (ARCA:GLD) long at 173.59 on 9/21/11
Long Term Trend monitor purposes: Flat

Timers Digest reported the Ord Oracle number 9 in performance for one year updated August 9.
This week is option expiration week which normally has a bullish bias. There is a large open gap that formed from the July 30 close to the open on July 31. Normally the bigger the gap the more likely that gap will get filled. It has been a bearish sign for a market for a gap to get tested on lighter volume. The July 31 gap on the SPY had volume of 183 million shares and if the market rallies to that gap on 10% or greater lighter volume would imply that gap has resistance and something we will be watching for. Today’s volume came in at 65 Million and if volume remains light going into the gap level (between 195.5 to 197 on the SPY) will imply resistance. The McClellan Oscillator is now above the “0” (bullish for market) and making higher highs which is also bullish. We did raise our stop on the SPY long position to 1930. Long SPX on 8/7/14 at 1909.57; stop raised to 1930.
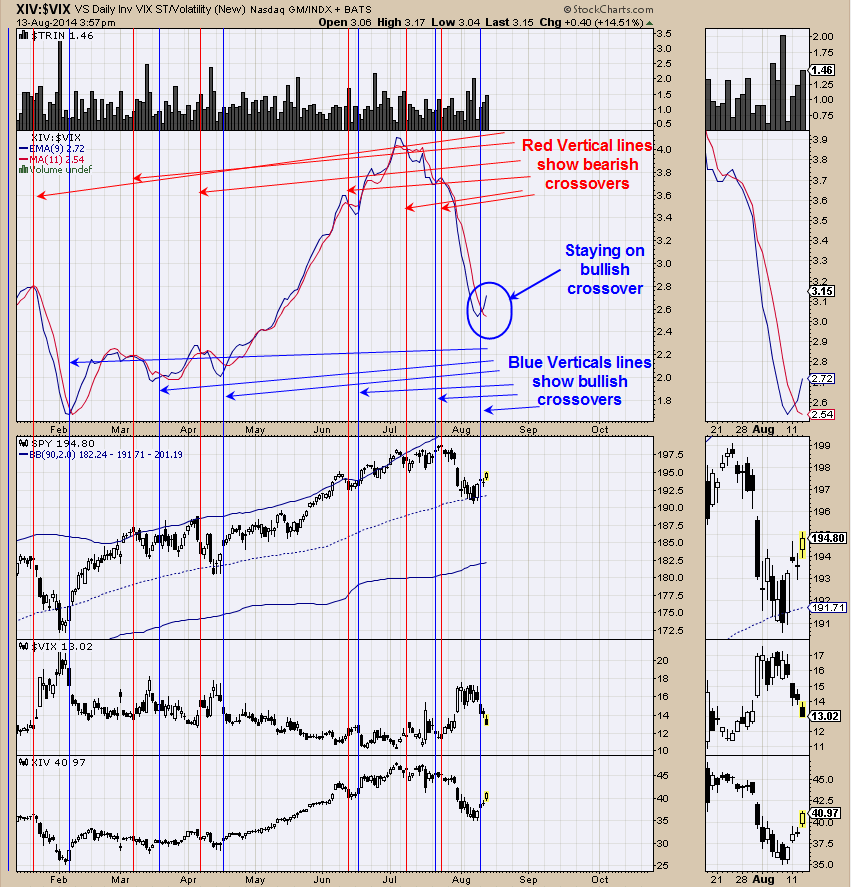
Above is the XIV/VIX ratio which is updated from yesterday. The XIV is the inverse of the VIX and the VIX is the new volatility index. This ratio has done well picking the direction to the SPY. The XIV/VIX is with an exponential moving average of 9 along with an 11 period moving average which produce bullish and bearish crossover. The blue vertical lines show the bullish crossover and the red vertical lines show the bearish crossovers. Monday a bullish crossover was triggered and a short term bullish sign for the SPY. The bullish crossover has widen and suggests short term higher prices for the SPY.

Not all indicators work all the time and that may be the case with the COT Commercials this time around (commercials are have a bearish slant). Above is what we described before is a large Head and Shoulders bottom where the Head is the December 2013 low. We have been looking for a cycle low due in early August and there was a low then right out our Semi Circle cycle timeframe. From the early August low a “Sign of Strength” (SOS) was to appear and push the GDX through the Neckline resistance near 27. For the looks of things the “Sign of Strength” through the Neckline near 27 is in question. If volume was up near 50 million then to us that would have been an “SOS” but volume of 30 million on yesterday’s break above 27 on Market Vectors Gold Miners (ARCA:GDX) is a little short. Like I said, “Not all indicators work all the time”. The Commercials in the COT readings also have us hesitant in their short position in Gold is rather high and a bearish sign for gold short term. We will wait for better evidence on a bullish signal short term.