Monitoring purposes S&P 500: Sold 9/30/14 at 1972.29= gain .003%; Long SPX on 9/25/14 at 1965.99.
Monitoring purposes Gold: Gold ETF GLD long at 173.59 on 9/21/11
Long Term Trend monitor purposes: Flat

Timers Digest reported the Ord Oracle number 10 in performance for one year updated October 27.
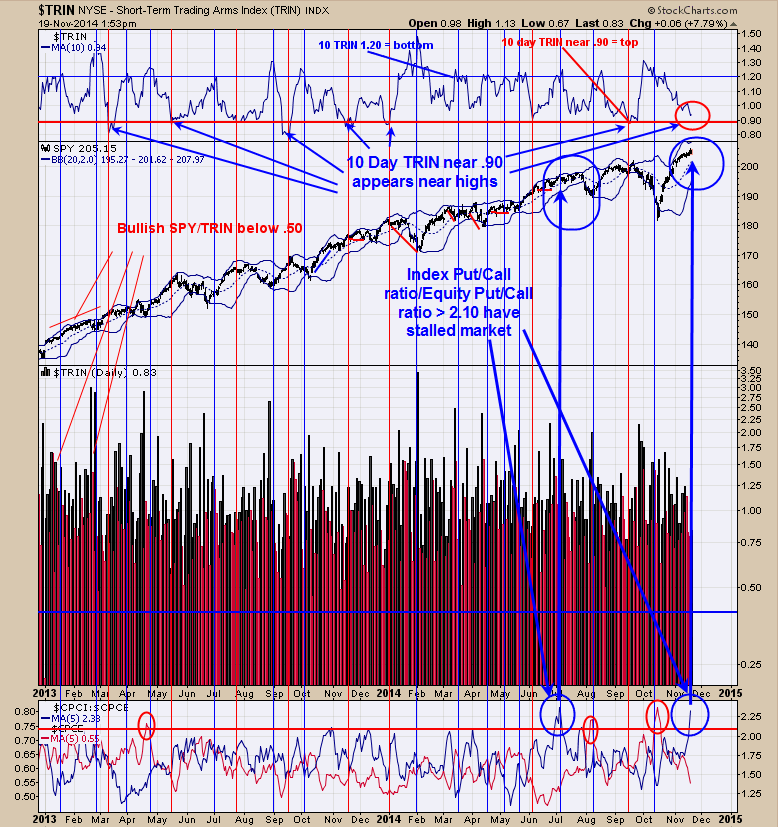
The top window is the 10 period moving average of the TRIN. The red verticals lines show when the 10 period TRIN reached below .90 and in most cases the market was near a high. The blue vertical lines show when the 10 period TRIN is above 1.20 and in most cases the market was near a low. The 10 day moving average of the TRIN sets at .94 up from .93 yesterday and in general is moving towards a bearish resolution. The bottom window is the Put/Call ratio for the indexes/Put/Call ratio for the Equities with a 5 period moving average. When this ratio gets above 2.10 the market at least stalls if not decline. This ratio stands at 2.38. This is expiration week which normally has a bullish bias and market could hold up the rest of the week. We have a cycle low due around Thanks Giving which does not leave much time for a decline. Seasonality turns back to bullish after Thanks Giving and stays bullish into first of January. A better trade may be waiting for the pull back and look for a buy signal around Thanks Giving. We will see how the statistics jell going into option Expiration Friday.

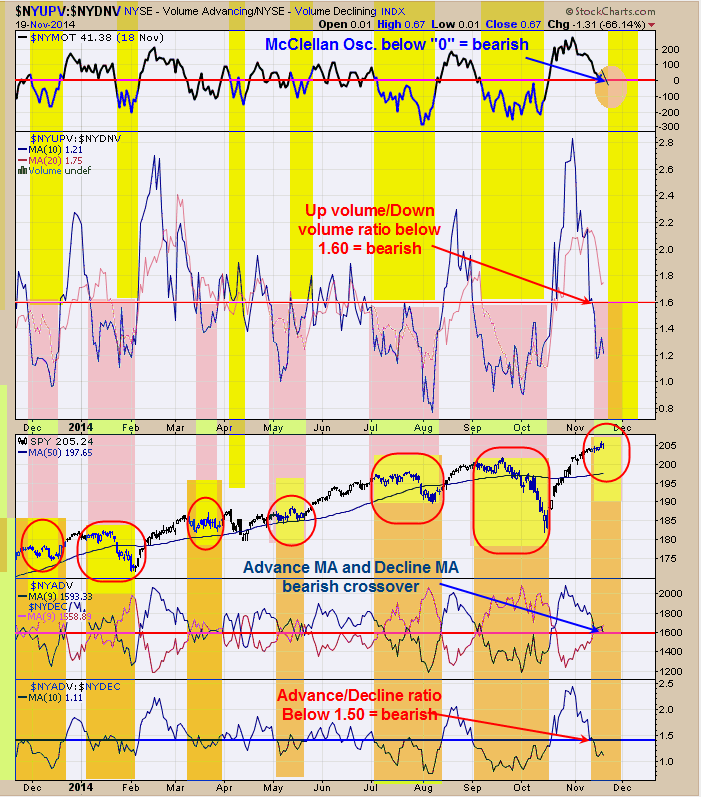
The chart above helps to define the health of the market. The top window is the McClellan oscillator. Readings below “0” are bearish sign and today’s close -8.60. Next window down is the Up Volume/Down Volume ratio. A close below 1.60 on this ratio is a bearish condition for the market. This ratio has been below 1.60 for the last several days. The bottom window is the Advance/Decline ratio and readings below 1.50 have been a bearish sign for the market. This ratio also has been below 1.50 for several days. Next window up is the Advancing issues with 9 period moving average and Declining issues with 9 period moving average. When the Red line is above the blue line than that shows there are more stocks declining than advancing and today there was a bearish crossover. Next chart up is the SPY. The red circles that outline the yellow areas on the SPY chart show when All four of the indicators mentioned above are in bearish areas. Notice that some of the bearish red circled areas on the SPY just trended sideways for several weeks before heading higher and other times the sideways action lead to declines. What we can say at this point that upside gains form here most likely will be limited. This is option expiration week and market may hold up the rest of the week and so will be looking what the statistics say in the next two days.

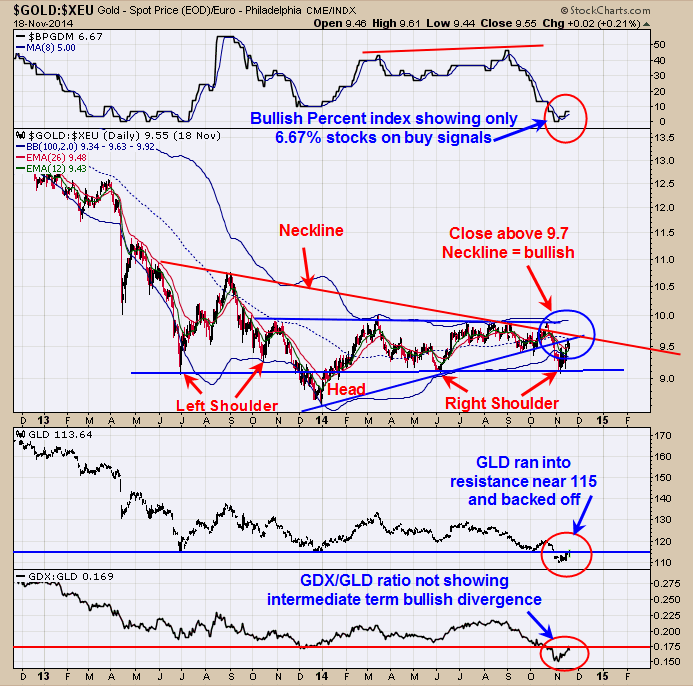
The bottom window is the GDX/GLD ratio. When this ratio is rising than that is bullish both for gold and gold stocks. Short term this ratio is showing positive divergence but has not produced intermediate term positive divergence. Next window up is the ETF for Gold (GLD). This ratio is still below the recent lows of June and December 2013 near 115. A close above 115 with a “Sign of Strength” would help to turn the bigger picture bullish. Yesterday GLD ran into 115 resistances and today back off from that resistance, which keeps GLD in a bearish mode. Next is the Gold/XEU ratio. This ratio appears to be drawing a large Head and Shoulders bottom where the Left and Right shoulders both have two humps and are symmetric. A break above the Neckline near 9.7 with a “Sign of Strength” would be a bullish sign and this ratio is pushing towards that level. A rising Gold/XEU ratio would be a bullish condition of Gold. There are short term bullish signs but the intermediate term picture has not triggered a bullish condition. Last Friday’s COT readings for Gold for the Commercials came in at 50k contracts short Gold which has corresponded with lows in gold over the last 10 years. The Commercials are considered the smart money and are usually right but have a history of being early on there signals. A signal for an intermediate term low in gold and gold stock is still incomplete.
