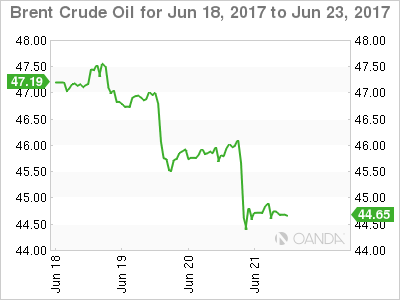
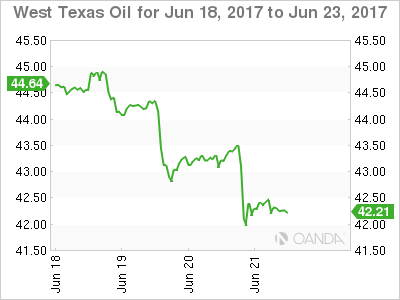
Oil’s suffering continued overnight with both Brent and WTI finishing over 2 percent lower in the New York session. The story, however, isn’t the headline fall for the session, it is the price action after the U.S. EIA Crude Inventory numbers. Inventories fell by a larger than expected 2.45 million barrels with gasoline inventories also falling 0.6 million barrels. Crude immediately bounced about one dollar, but both Brent and WTI ran into a brick wall of sellers and collapsed some 4 percent to both finish near their lows.
The fact that oil is now falling on a bullish inventory number must be a red light for producers and traders alike. One implication is that U.S. shale producers have moved their hedges lower and are selling oil futures on any rally from these levels as per last night. The other is that OPEC/Non-OPEC must now confront the oil elephant in the room, increasing the overall production cut from its present levels. The other choice will be to let the market set the price which may mean oil drops to a level that even the newly slimline U.S. shale industry struggles to break even at. OPEC may be forced to choose the least ugly horse in the glue factory in a Hobson’s choice nightmare.
Brent spot trades at 44.60 with Asia’s dead cat bounce over as soon as Europe has walked in. Resistance is at last night’s highs around 46.50 followed by 47.70. Technical support is absent until the November low at 42.95 followed by the must hold 41.00 region.

WTI spot trades at 42.15 this morning with its nascent rally meeting the same fate as Brent’s. Resistance is at 44.00 and 45.00. Support is just below at 42.00 followed by a charting black hole until the 39.00 region.

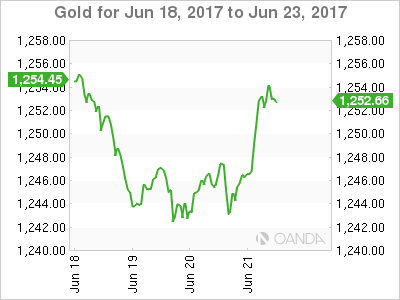
Gold finally showed some signs of life overnight with a weak pulse helping the yellow metal climb seven dollars to finish at 1252.00 for the New York session. The uncontrolled oil price spill in the futures markets may have seen some traders pushing the risk aversion button and buying gold. The primary driver, however, appears to be the flattening of the longer-dated U.S. Treasury curve, particularly the 10/30 year spread as the bond market continues to call the Federal Reserve’s bluff on the trajectory of U.S. rates and the underlying health of the economy.
With the weekend rapidly approaching and the carnage in the oil market, which is rattling investors, we may see some buying emerge in precious metals to hedge risk aversion in what is a very data-light week.
Gold is trading at 1252.00 in early Europe with the 100-day moving average at 1248.35 below the initial support followed by 1240. Above, gold has a clear run until first resistance at 1257.00 followed by 1267.00, some distance behind.
