
The USD/THB pair features the world’s “safest” currency in the form of the US dollar, and one of the highest “risk on” currencies in Asia, the Thai baht. This is a good proxy for Asian growth, and can often represent the possible flow of goods from Asia to North America or Europe. The Thai economy is a very dynamic one, but in that dynamic behavior is often a lot of volatility.
The attached chart is a monthly one. The pair broke out recent, as shown by the dashed blue line. This completed a “W” pattern, and the market appears to be lurching forward now as a result. Certainly, the Dollar has been positive overall, and a lot of traders are much more comfortable in the US than places like Thailand at the moment. Because of this, I believe this pattern will continue. In fact, there is the “height” of the “W” pattern that once measured suggests that we are going 3.0 handles higher. This leads us to the 36 handle, which shows us a massively resistive area as well. If we get above that area, this pair can go much, much higher. However, I think breaking above that area will be a bit of a task.
Another point of interest for me is the fact that the Moving Average Convergence Divergence (MACD) has recently broke above the zero line, which shows that the momentum has in fact shifted to the upside. While I don’t normally trade this signal alone, it certainly can add to the case for a positive move.
I see the 36 level as the next serious target. The area might not be hit for a while, and as this is the monthly chart, it is of course a longer-term play. Perhaps a trade that lasts several months, but with the concerns around the world, and the possible tapering by the Federal Reserve, there should be continued interest in the USD overall. 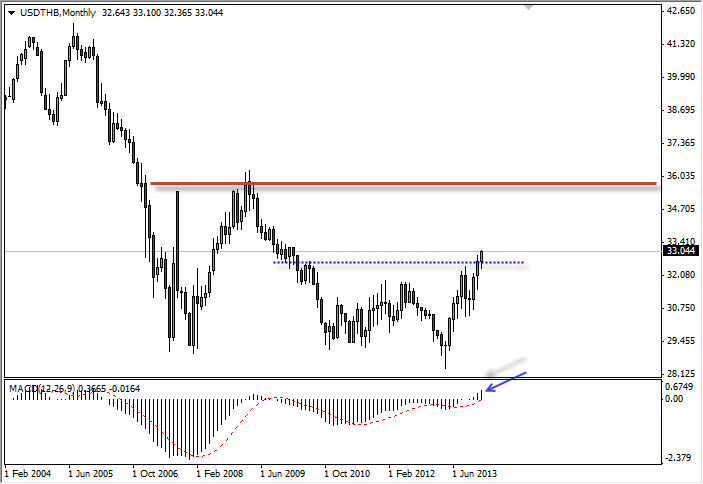 USD/THB Monthly Chart" title="USD/THB Monthly Chart" width="452" height="484">
- English (UK)
- English (India)
- English (Canada)
- English (Australia)
- English (South Africa)
- English (Philippines)
- English (Nigeria)
- Deutsch
- Español (España)
- Español (México)
- Français
- Italiano
- Nederlands
- Português (Portugal)
- Polski
- Português (Brasil)
- Русский
- Türkçe
- العربية
- Ελληνικά
- Svenska
- Suomi
- עברית
- 日本語
- 한국어
- 简体中文
- 繁體中文
- Bahasa Indonesia
- Bahasa Melayu
- ไทย
- Tiếng Việt
- हिंदी
Thai Bhat Continues To Fall
Published 01/07/2014, 10:46 AM
Updated 07/09/2023, 06:31 AM
Thai Bhat Continues To Fall
3rd party Ad. Not an offer or recommendation by Investing.com. See disclosure here or
remove ads
.
Latest comments
Install Our App
Risk Disclosure: Trading in financial instruments and/or cryptocurrencies involves high risks including the risk of losing some, or all, of your investment amount, and may not be suitable for all investors. Prices of cryptocurrencies are extremely volatile and may be affected by external factors such as financial, regulatory or political events. Trading on margin increases the financial risks.
Before deciding to trade in financial instrument or cryptocurrencies you should be fully informed of the risks and costs associated with trading the financial markets, carefully consider your investment objectives, level of experience, and risk appetite, and seek professional advice where needed.
Fusion Media would like to remind you that the data contained in this website is not necessarily real-time nor accurate. The data and prices on the website are not necessarily provided by any market or exchange, but may be provided by market makers, and so prices may not be accurate and may differ from the actual price at any given market, meaning prices are indicative and not appropriate for trading purposes. Fusion Media and any provider of the data contained in this website will not accept liability for any loss or damage as a result of your trading, or your reliance on the information contained within this website.
It is prohibited to use, store, reproduce, display, modify, transmit or distribute the data contained in this website without the explicit prior written permission of Fusion Media and/or the data provider. All intellectual property rights are reserved by the providers and/or the exchange providing the data contained in this website.
Fusion Media may be compensated by the advertisers that appear on the website, based on your interaction with the advertisements or advertisers.
© 2007-2024 - Fusion Media Limited. All Rights Reserved.