In this past weekend’s newsletter, I laid out a case for a bounce this week due to the continuous string of S&P 500 declines previously that had reached an extreme. To wit:
This past week that support gave way leading to the first 9-day straight decline in the index since 1980.
However, as I explained during the ‘Real Investment Hour‘ on Thursday, it is never advisable to “panic sell” when a break of support occurs. This is because that by the time you have an extended period of selling, the markets tend to be oversold enough for a short-term reflexive bounce to rebalance portfolio risk at better levels.
The chart below is a daily chart showing the market currently bouncing off support at the 200-dma combined with a 3-standard deviation move from that short-term moving average. This all suggests a reflexive bounce from oversold conditions is extremely likely.
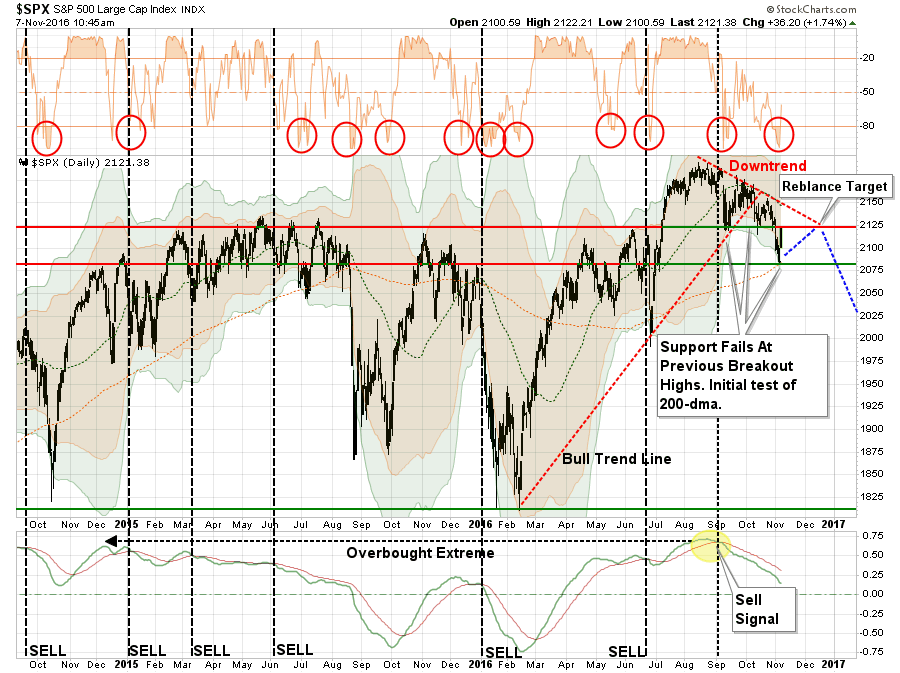
That bounce came on Monday as traders frantically covered bearish bets launching asset prices higher. However, while the bounce was certainly a welcome relief after a long stretch of selling, we are now struggling with multiple levels of previous resistance.
As noted on the chart above, there is a confluence of events currently occurring that suggests further downside risk following the reflexive bounce illustrated by the blue dashed line.
- The downtrend resistance from the previous highs is colliding with the previous support level which now acts as important resistance.
- The 50-dma is also trending downward adding further resistance to price advances in the near-term.
- An important “sell signal” has been registered at fairly high levels and current remains intact.
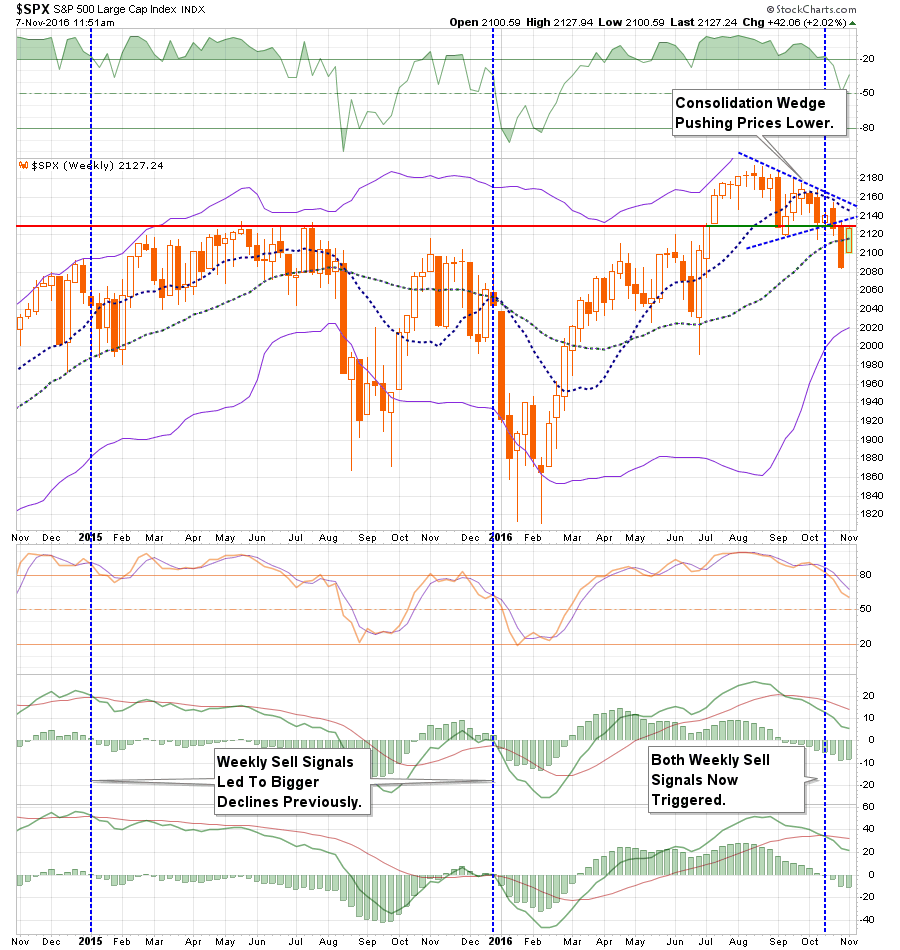
However, if we step back to a longer-term (weekly) picture we get further evidence of the potential for more corrective action to come.”
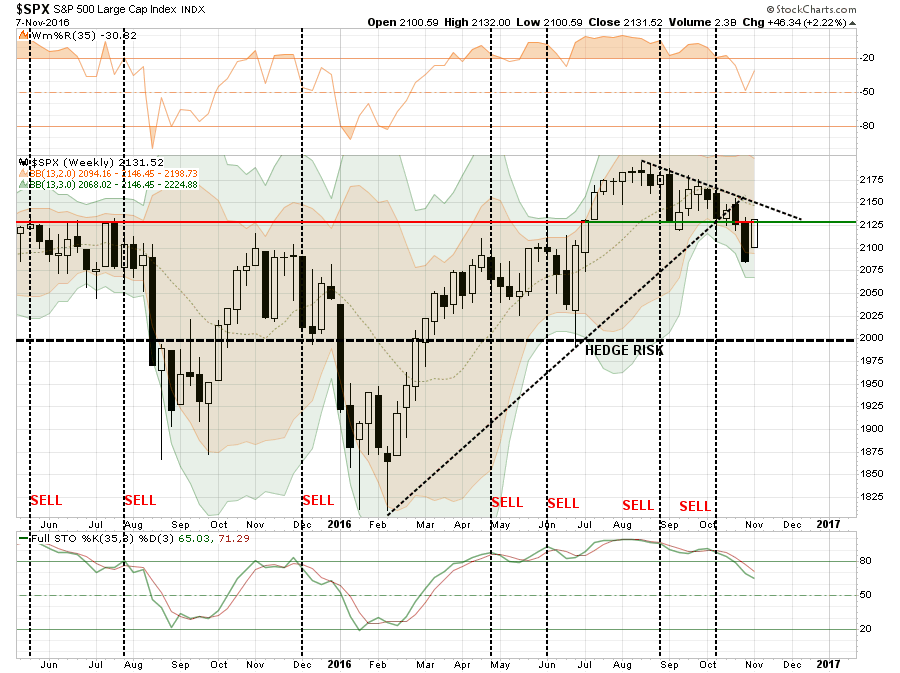
Even on a weekly basis, sell signals are currently being registered which have typically suggested further deterioration in the markets to come. This supports the idea that any reflexive bounces, particularly following the election this week, should be used to rebalance portfolio risk accordingly.
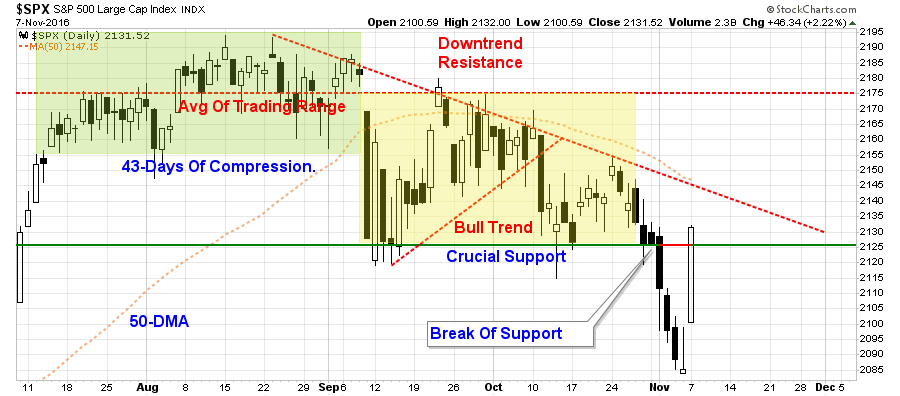
If we zoom in on a daily chart we can get a better view of the “traffic” that lies ahead. This confluence of resistance will require a substantial push in the markets to clear. However, a move above the current downtrend resistance should allow for a push back to 2175.
It is important, as an investor, is not to ‘panic’ and make emotionally driven decisions in the short-term. All that has happened currently is a ‘warning’ you should start paying attention to your investments.
Just be cautious for the moment.
As I recommended this past weekend, use this rally to take some actions in portfolios to reduce risk and clean up allocation models.
- Tighten up stop-loss levels to current support levels for each position.
- Hedge portfolios against major market declines.
- Take profits in positions that have been big winners
- Sell laggards and losers
- Raise cash and rebalance portfolios to target weightings.
As voters go to the polls today to finally put one of the most contentious presidential elections out of its misery, the question is now what happens next?
Markets & Seasonal Tendencies
The technical deterioration of the markets, combined with weakening economic and earnings data, suggest the markets are likely to struggle in the months ahead. However, there is a reasonable expectation that following a weak summer performance, that there could be better performance as we enter the historically stronger period of the investment year.
As StockTraders Almanac penned:
The ‘Best Six Months’ switching strategy found in our annual Stock Trader’s Almanac which is basically the flip side of the old “sell in May and Go Away” adage. After decades of historical research, we discovered that most market gains occur during the months November through April. Investing in the Dow Jones Industrial Average between November 1st and April 30th each year and then switching into fixed income for the other six months has produced reliable returns with reduced risk since 1950.
The “Best Months” Switching Strategy will not make you an instant millionaire as other strategies claim they can do. What it will do is steadily build wealth over time with half the risk (or less) of a “buy and hold” approach.
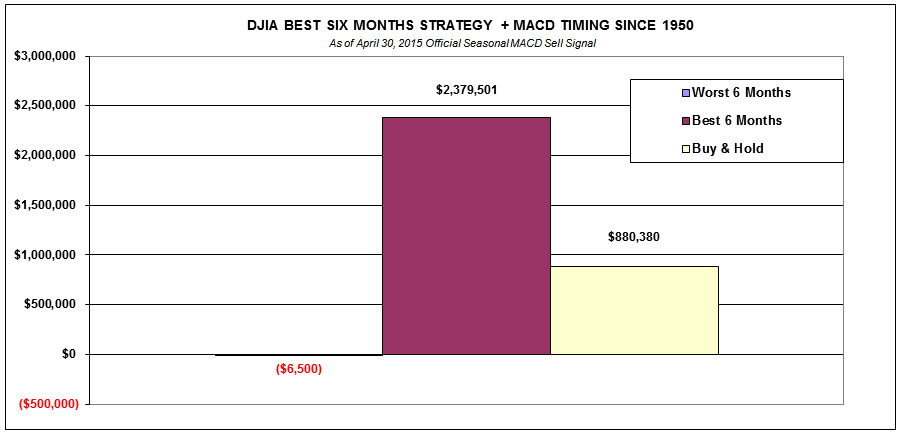
Use of the words buy and sell has created some confusion when used in conjunction with this strategy. They are often interpreted literally, but this is not necessarily the situation. Exactly what action an individual investor or trader takes when we issue our official fall buy or spring sell recommendation depends upon that individual’s goals and, most importantly, risk tolerance.
A more conservative way to execute our switching strategy, the in-or-out approach as we like to refer to it entails simply switching capital between stocks and cash or bonds.
This is a very important point.
When a strategy to manage portfolio risk is discussed, it is often dismissed by the media with some “cherry-picked” period suggesting the strategy didn’t work and you “missed out” of a market advance. Interestingly, they never pick a point in history where it worked and you bypassed a large loss of capital.
NO STRATEGY works all of the time. However, a good strategy that generally participates in rising markets and avoids a bulk of the eventual declines handily beats “buy and hold” strategies over the long-term.
The chart below shows the growth of a 10,000 investment from 1957 to present using a pure switching strategy between the seasonally strong and weak periods of the year.
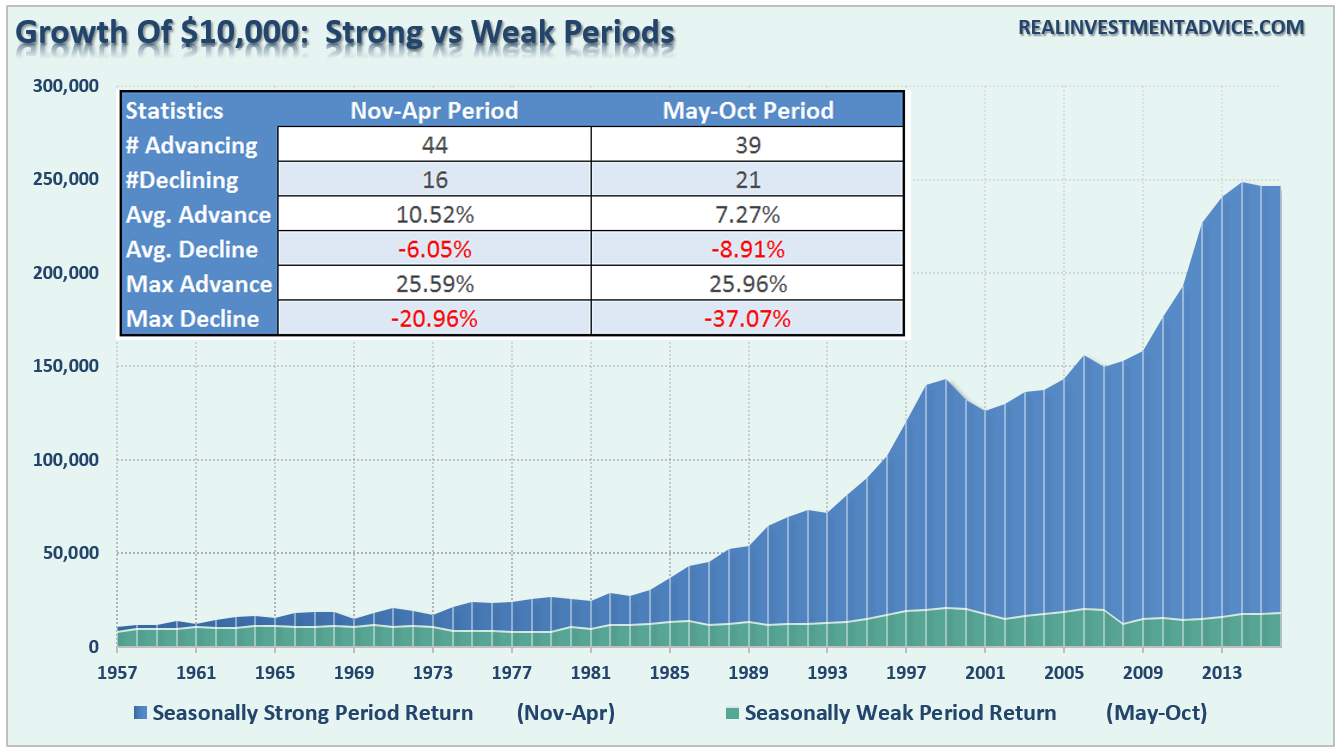
As noted above, there is a statistical probability that the markets will potentially try and trade higher over the next couple of months particularly as portfolio managers try and make up lost ground from the summer.
However, it is important to note that not ALL seasonally strong periods have been positive. Therefore, while it is more probable that markets could trade higher in the few months ahead, there is also a not-so-insignificant possibility of a continued correction phase.
Furthermore, the probability of a continued correction is increased by factors not normally found in more “bullishly biased” markets:
- Weakness in revenue and profit margins
- Deteriorating economic data
- Deflationary pressures
- Increased bearish sentiment
- Declining levels of margin debt
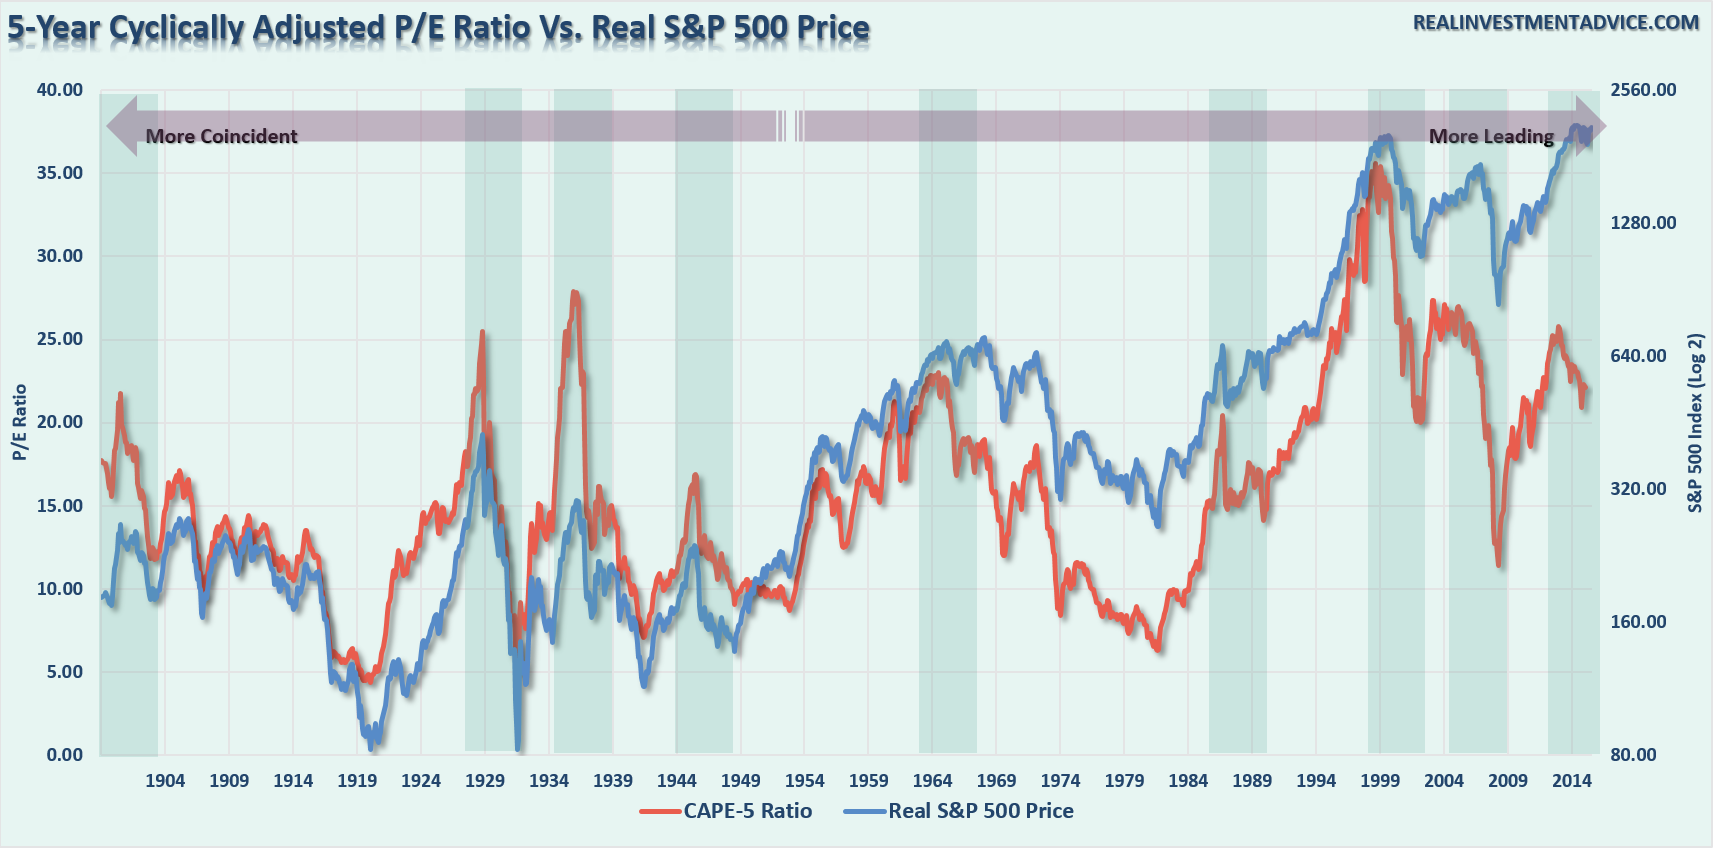
- Contraction in P/E’s (5-year CAPE)
How To Play It
With the markets currently in extreme short-term oversold territory and encountering a significant amount of overhead resistance, it is likely the current reflexive rally that began on Monday could have further to go. However, with overhead resistance fairly strong, and given the ongoing number of weekly “sell signals,” it is currently advised to remain more cautious until a more bullish “trend” reasserts itself.
For individuals with a short-term investment focus, pullbacks in the market can be used to selectively add exposure for trading opportunities. However, such opportunities should be done with a very strict buy/sell discipline just in case things go wrong.
For longer-term investors, and particularly those with a relatively short window to retirement, the downside risk far outweighs the potential upside in the market currently. Therefore, using the seasonally strong period to reduce portfolio risk and adjust underlying allocations makes more sense currently. When a more constructive backdrop emerges, portfolio risk can be increased to garner actual returns rather than using the ensuing rally to make up previous losses.
I know, the “buy-and-hold” crowd just had a cardiac arrest.
However, it is important to note that you can indeed “opt” to reduce risk in portfolios during times of uncertainty. As my colleague Jesse Felder noted:
It was nearly a year ago that I looked back at times when stocks became ‘extremely overvalued’ and then the trend turned down. In every case, it paid very handsomely for investors to implement a system that either shifted to cash (and avoided major drawdowns) or actually got short the major indexes (to profit from major drawdowns).
The point is that an extremely overvalued and over-bullish stock market that shifts from uptrend to downtrend is the sort of rare environment that has led to the largest declines in history. For this reason, it presents investors with the most dangerous of all possible environments.
This is not a market that should be trifled with or ignored. With the current market and economic cycles already very long by historical norms, the deteriorating backdrop is no longer as supportive as it has been.
“Benchmarking” your portfolio remains a bad choice for most investors with a visible time frame to retirement. While it is true that over VERY long periods of time, “benchmarking” your portfolio will indeed lead to gains. The problem is that most individuals do not have 116 years to garner 8% annualized rates of return.
The index is a mythical creature, like the Unicorn, and chasing it takes your focus off of what is most important – your money and your specific goals. Investing is not a competition and, as history shows, there are horrid consequences for treating it as such.
Incorporating some method of managing the inherent risk of investing over the full-market cycle is crucially important to conserving principal and creating longer-term risk-adjusted returns. While you will probably not beat the index from one year to the next, you are likely to arrive at your financial destination on time and intact. But isn’t that really why you invested in the first place?

