EUR/USD
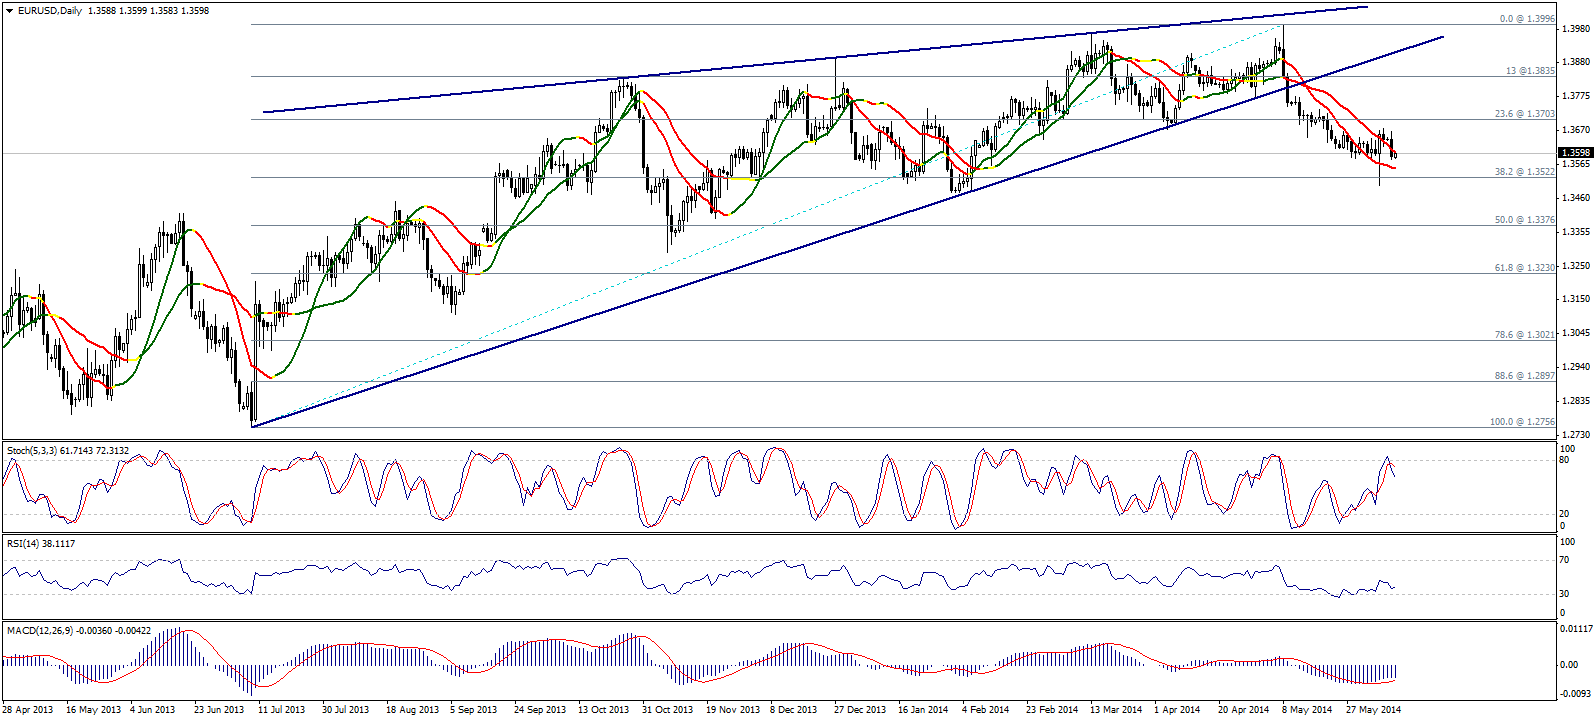
The pair dropped yesterday and Stochastic is showing a negative momentum as a long bearish candle was formed yesterday. Meanwhile, the pair failed to break the support 1.3580 and stabilize below it forcing us to remain on the sidelines now.
Breaking 1.3580 is required to confirm extending the downside move in a new attempt to touch 38.2% correction at 1.3520. On the other hand, trading again above 1.3625 could trigger a new attempt to the upside. Therefore, we will monitor the pair at the referred to levels.

GBP/USD
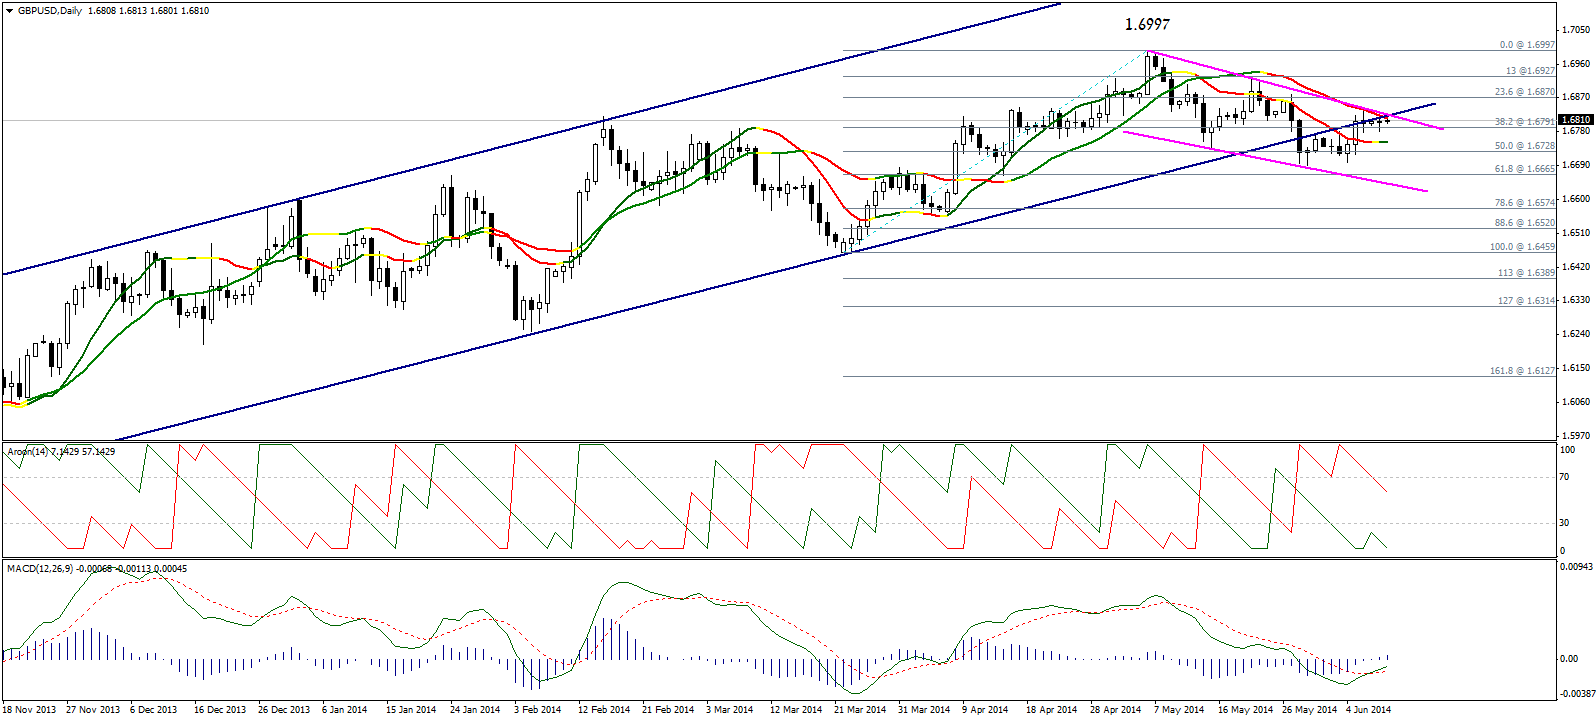
Trading remained limited below the resistance 1.6835 and above the support 1.6790 so we prefer to remain on the sidelines in this report. MACD is showing a positive crossover and AROON is showing weakness in the bearish strength. Linear Regression Indicators are negative and the pair is stable below the broken support of the ascending channel and below the resistance of the minor downside move that started from the top 1.6997 as showing on graph.
All the technical catalysts forces us to become neutral, whereas we need to confirm whether the pair is currently retesting the broken support of the ascending channel then will continue the downside moveor will it stabilize again above this support and trade again within the ascending channel.

USD/JPY
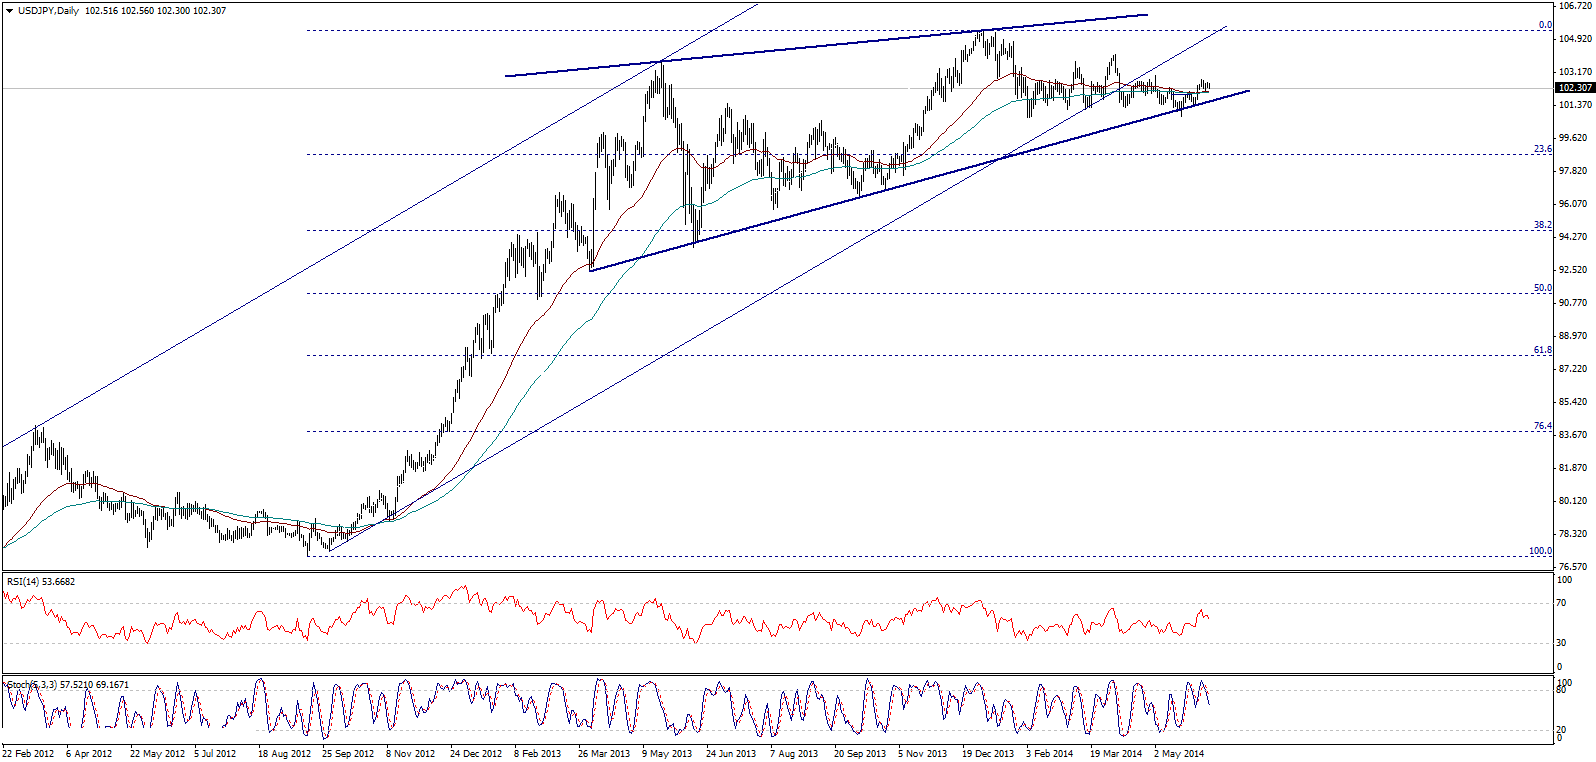
The pair is showing further tight sideways trading maintaining stability above SMA 50 and 100 that are still supporting the pair from the downside, while the overall upside move remains valid by stabilizing above the key support at 101.55. Hence, we target 104.45 then 105.40, as breaking 101.55 pushes the pair towards 98.75 before any new attempt to the upside.

USD/CHF
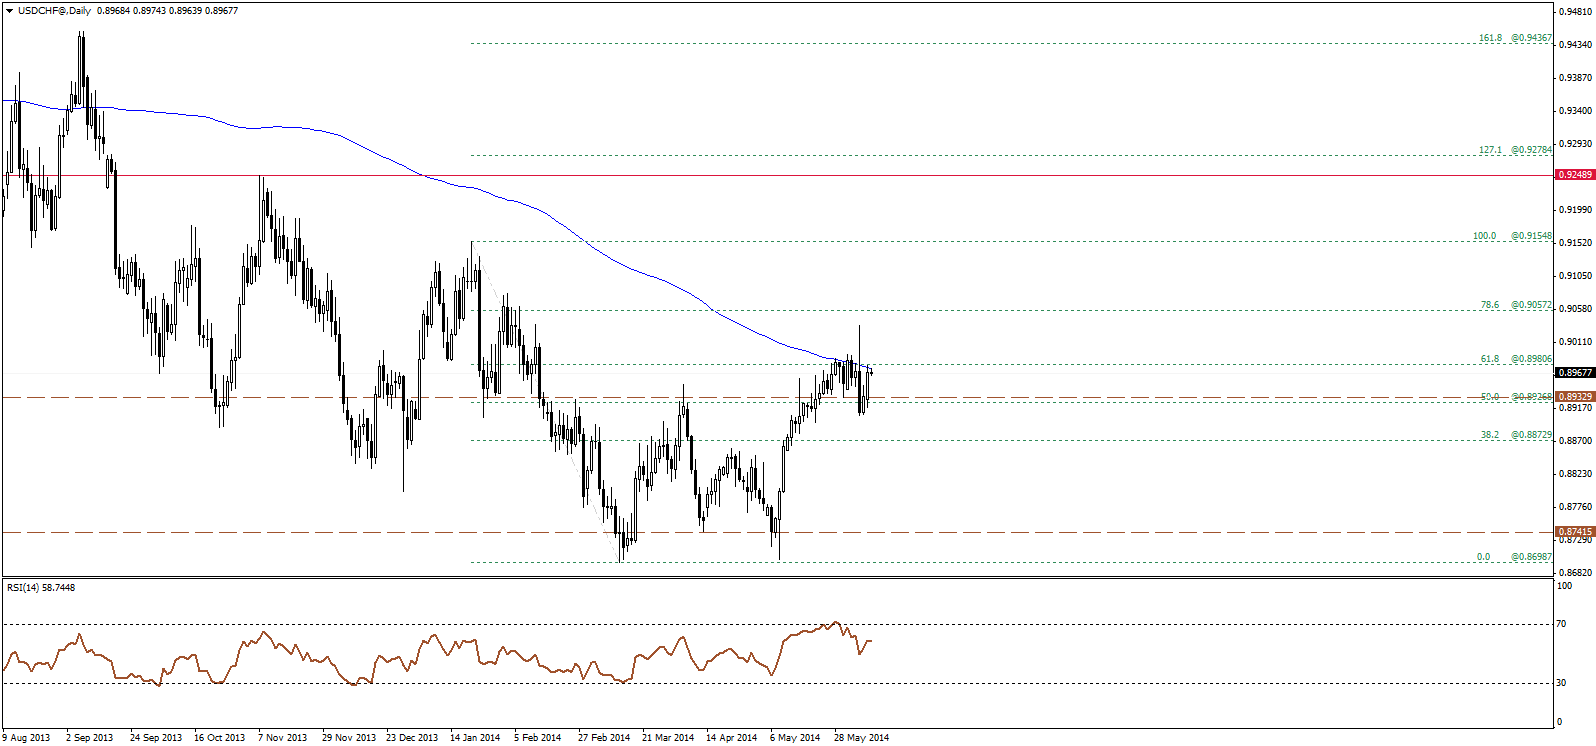
The USD/CHF pulled back higher, retesting the 200-days SMA again, but price remains below the latter, and 0.8980-0.9000 resistance level, and that keeps our bearish bias valid. Only a break with stability back above 0.9000 will probably signal the continuation of the bullish breakout, for now, the bearish scenario is favored over intraday basis.

USD/CAD
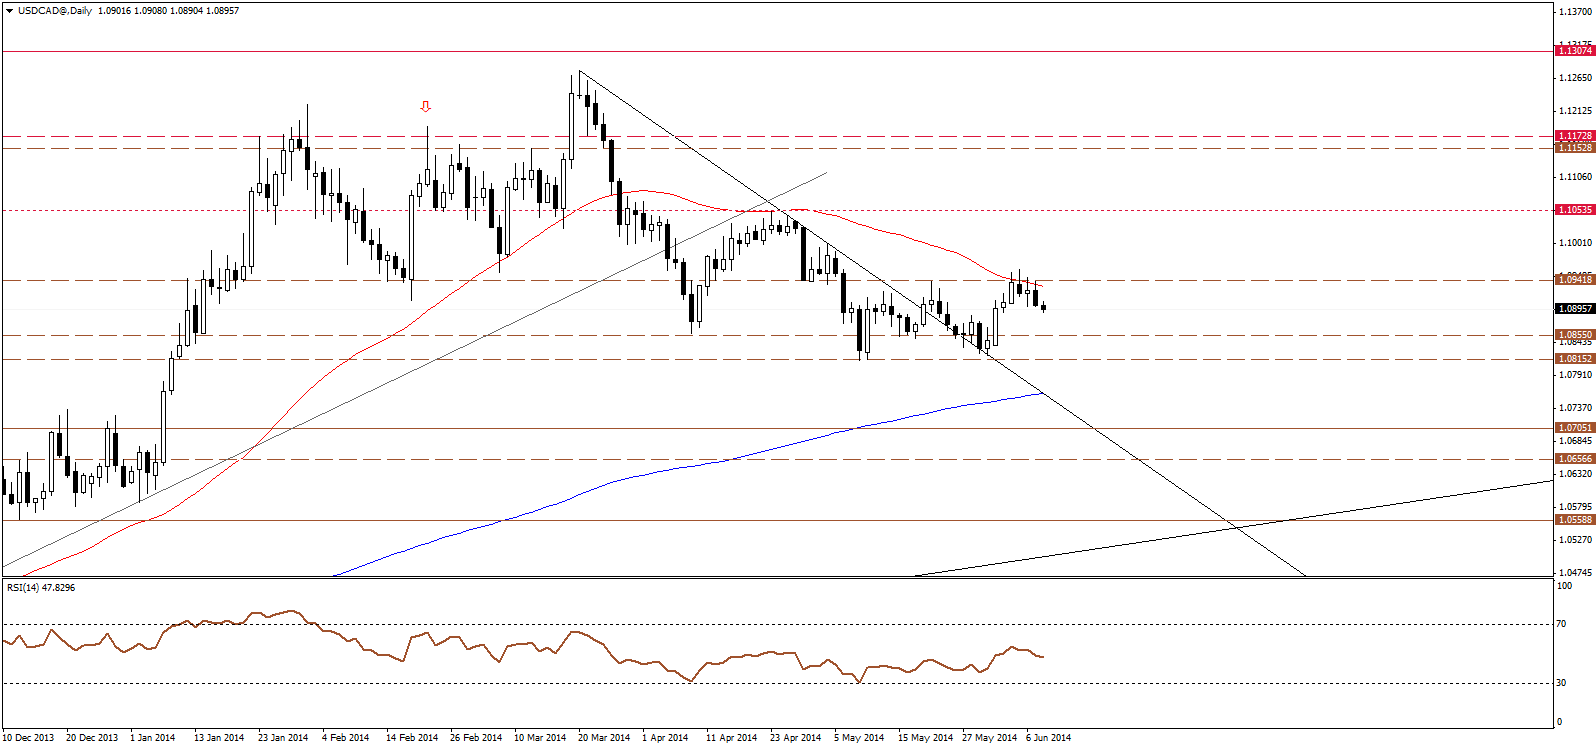
The USD/CAD is pushing back lower, after retesting the 50-days SMA and 1.0940 horizontal resistance level, where price failed to maintain the upside and break that resistance, currently approaching 1.0885 intraday support level. Accordingly, we prefer to move to the sidelines for now, and wait for signals of a bullish rebound over the shorter time intervals, or a break below 1.0885 to confirm more downside.

AUD/USD
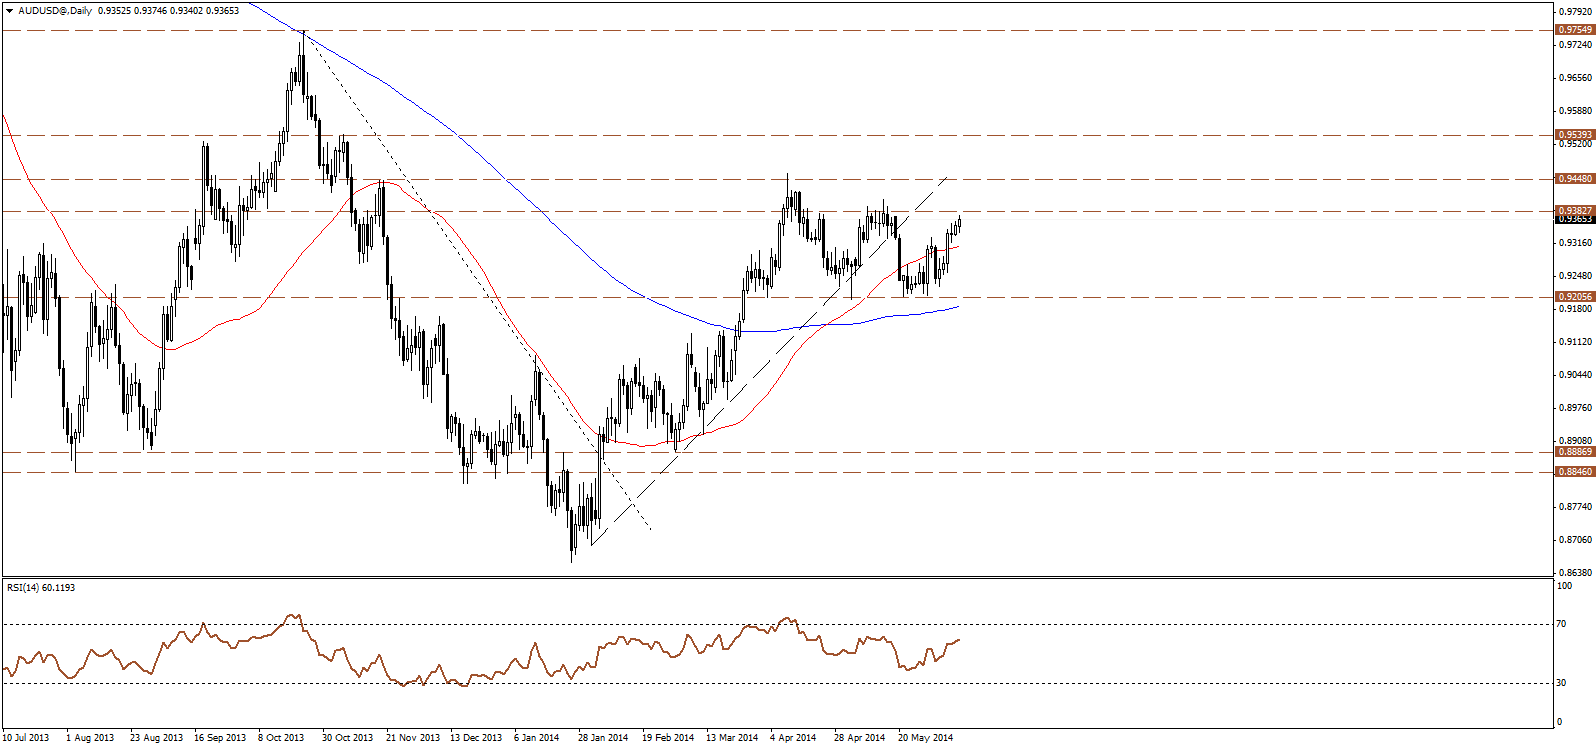
The AUD/USD extended the bullish wave settling above the 50-days SMA and approaching the next resistance level near 0.9400, the bullish bias will probably continue towards that resistance followed by 0.9450 major swing higher. The bullish bias remains favored so long as 0.9300 level is intact over intraday basis.

NZD/USD
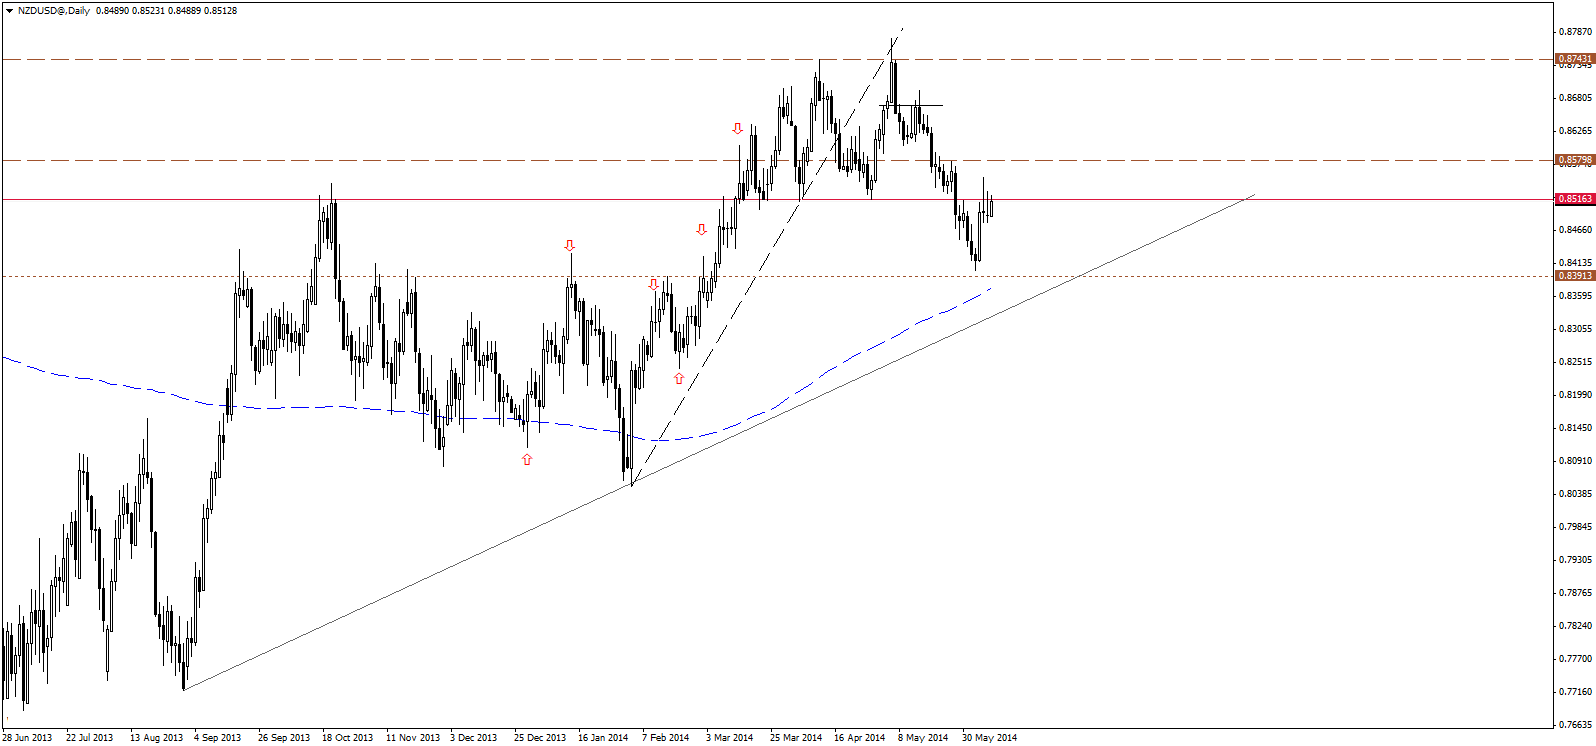
The NZD/USD continues to fluctuate near the main resistance level at 0.8515 , which is the neckline for a bearish formation, where price formed two long legged doji candles at that key level, accordingly, the bearish chances remains high, unless price manages to decisively break and hold above that resistance.

