EUR/USD
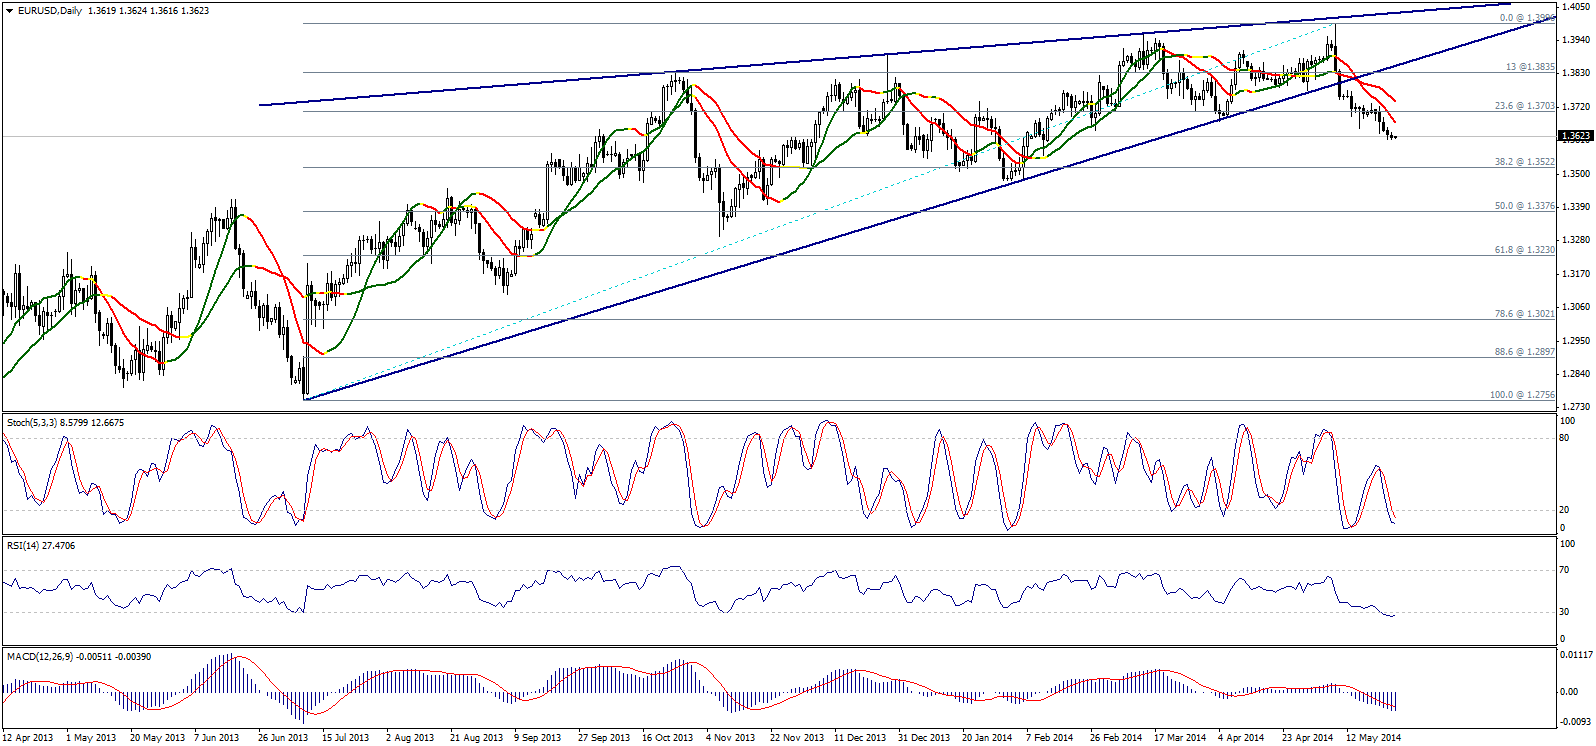
The pair dropped last week and kick-started trading Monday with negativity, affected by the breakout below 23.6% Fibonacci correction of the upside wave from the low at 1.2756 to the top at 1.3996. Trading below the 23.6% correction at 1.3700 is negative and might extend bearishness toward 38.2% at 1.3520 areas.
Linear Regression Indicators and MACD are negative, yet momentum indicators –Stochastic & RSI- are entering oversold areas and accordingly areas of 1.3750 must hold to preserve the bearish outlook and cancel chances for a retest of 1.3835 before resuming the downside move.

GBP/USD
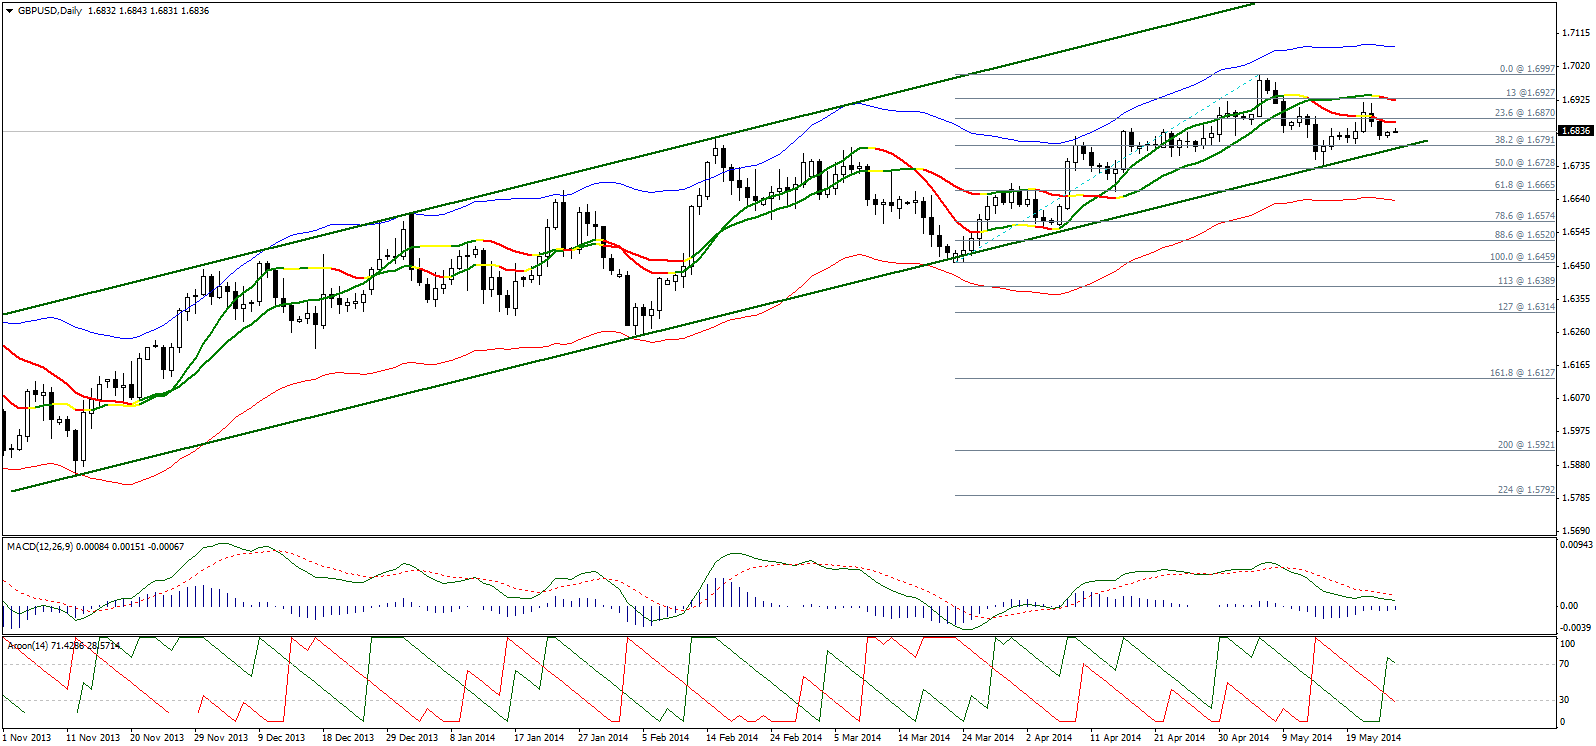
The failure to breach the critical resistance at 1.6920-30 kick-started the downside move, pushing GBPUSD to start the week below Linear Regression Indicators 34 & 55. Stability below 1.6930 keeps chances for the downside move intact, however a breakout below 1.6790 followed by stability below 1.6725 is required to confirm the extension of the downside move. The pair is still trading within the ascending channel and a breakout below the main support is required to confirm the negative reversal.
The negativity on LRIs and failure to hold above 1.6920 alongside negativity on MACD support chances for the breakout below the ascending channel support this week. On the other end, AROON still favors the upside move over bearishness and accordingly a breach of 1.6920 might trigger a new upside wave to carry the pair above 1.7000.

USD/JPY
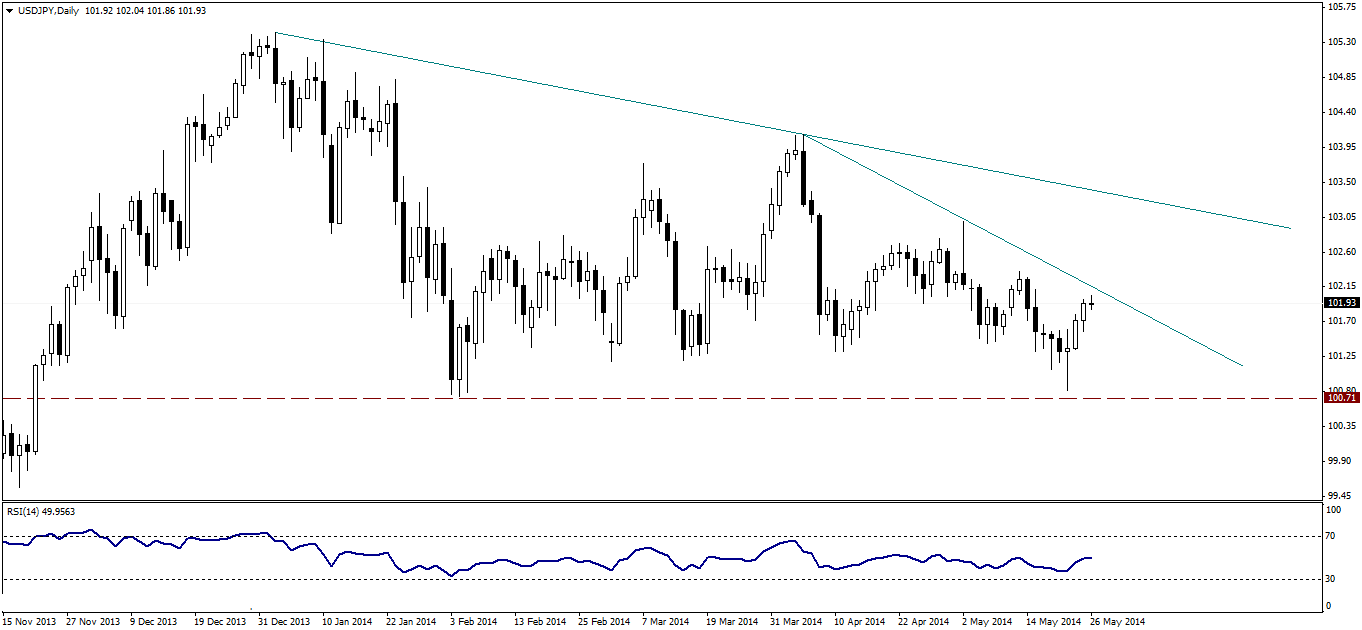
The pair is approaching the descending resistance at 102.15 and a breach of which will extend gains toward 103.40. In general, stability above 100.70 makes us favor the upside move over intraday basis, noting that a breach of 103.40 will extend gains toward 104.10 then 104.85.

USD/CHF
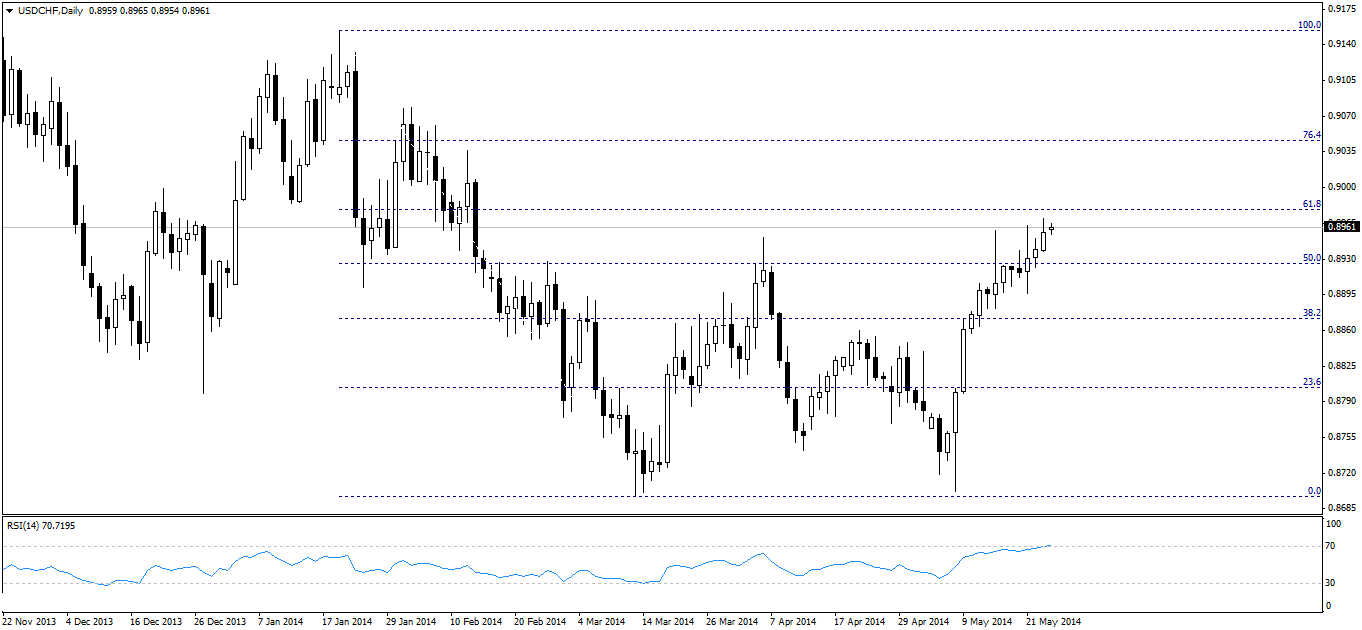
The pair is approaching 61.8% Fibonacci correction of the downside move on graph at 0.8980. A breach of this level will extend the upside move initially toward 0.9045 areas. To the downside, a breakout below 0.8925 will push the pair initially toward 0.8805 and accordingly we prefer to remain on the sidelines waiting for more confirmations.

USD/CAD
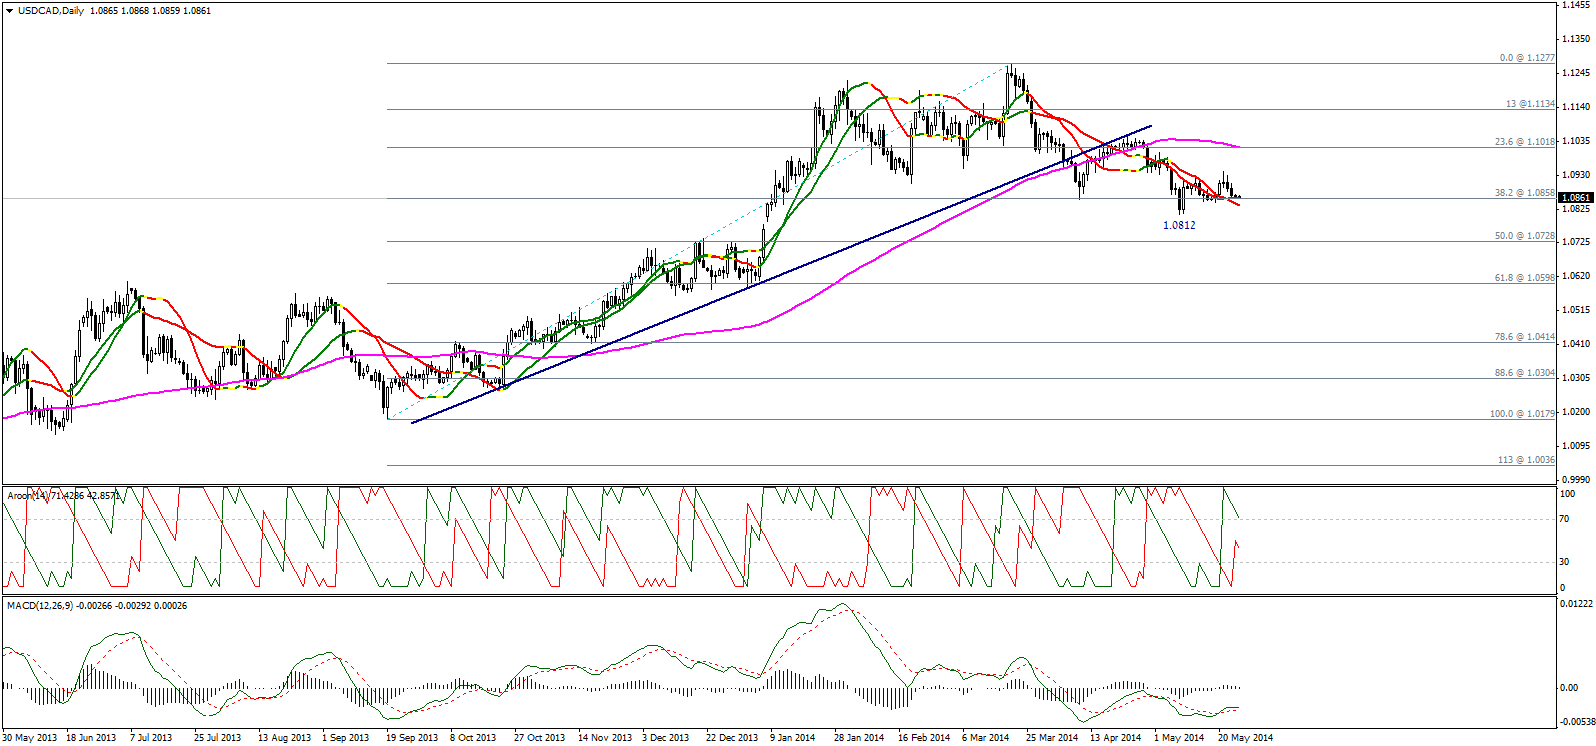
Since placing the top at 1.1277, the pair recorded lower highs and lower lows, which is negative accordingly to classic analysis, especially as trading is below the SMA 100 over daily basis. However, 38.2% correction confirmed its strength last week and managed to halt the downside move with the beginning and to the end of trading last week.
We still consider trading below 23.6% correction and the SMA 100 at 1.1020 negative, and stability below it might extend the downside move toward 1.0725 and a break of which will extend losses toward 1.0600 (the 50% and 61.8% correction respectively) while stability below 1.0945 will keep bearishness strongly valid.

AUD/USD
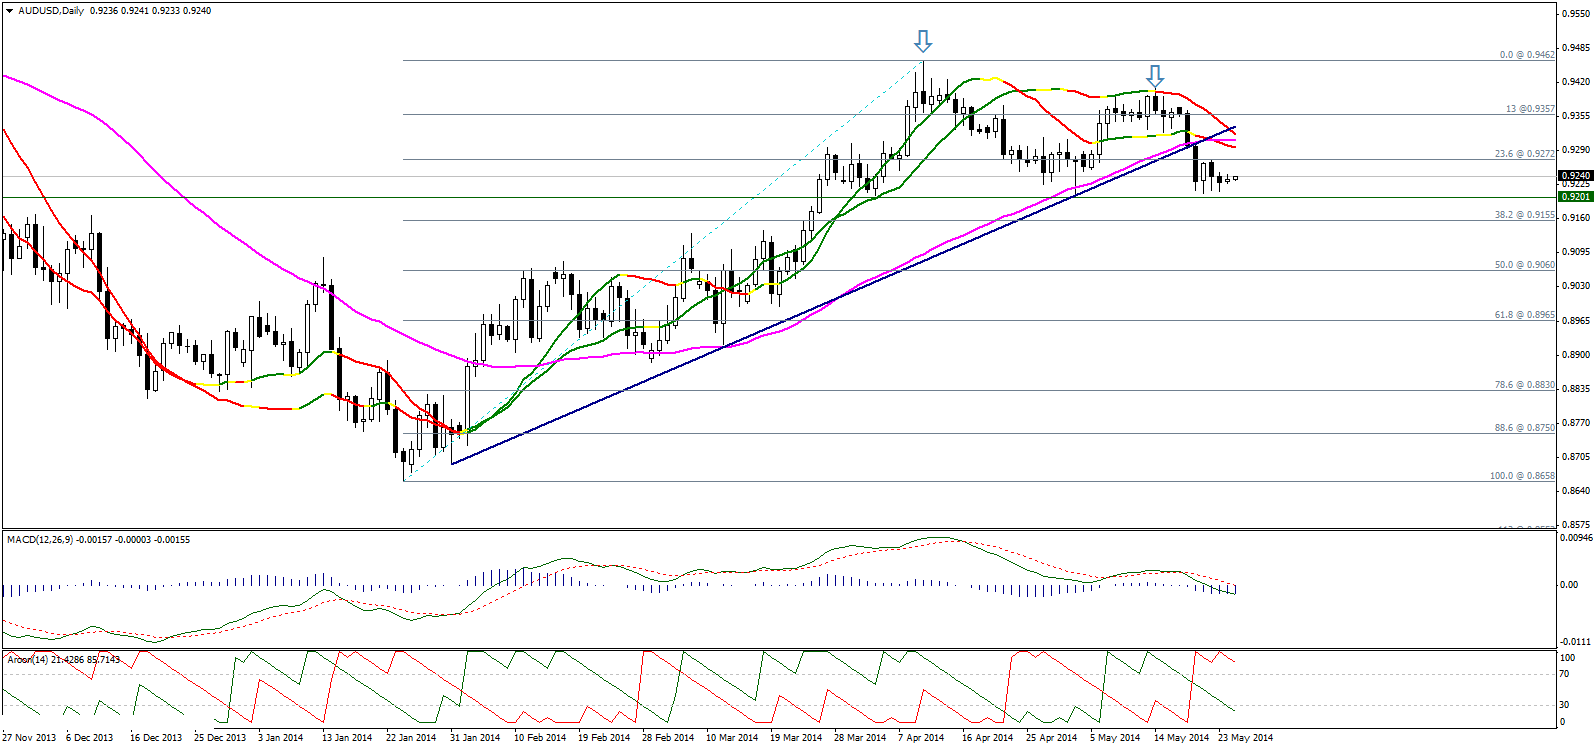
In terms of classic analysis, we cannot consider the formation above highlighted with the arrows as a Double Top formation unless the pair breaks below 0.9200, the neckline areas of the classic pattern. The breakout below the ascending support that carried trading from the low at 0.8658 and trading below 23.6% correction at 0.9275 keep bearishness in favor, especially as the Linear Regression Indicators broke the ascending support and trading below the SMA 50.
AROON is bearish and MACD is biased negatively and accordingly we believe that bearishness is in favor. A breach of 0.9360 with a daily closing risks failing the bearish outlook and will trigger a new upside wave targeting new tops close and maybe above the recent top recorded at 0.9462.

NZD/USD
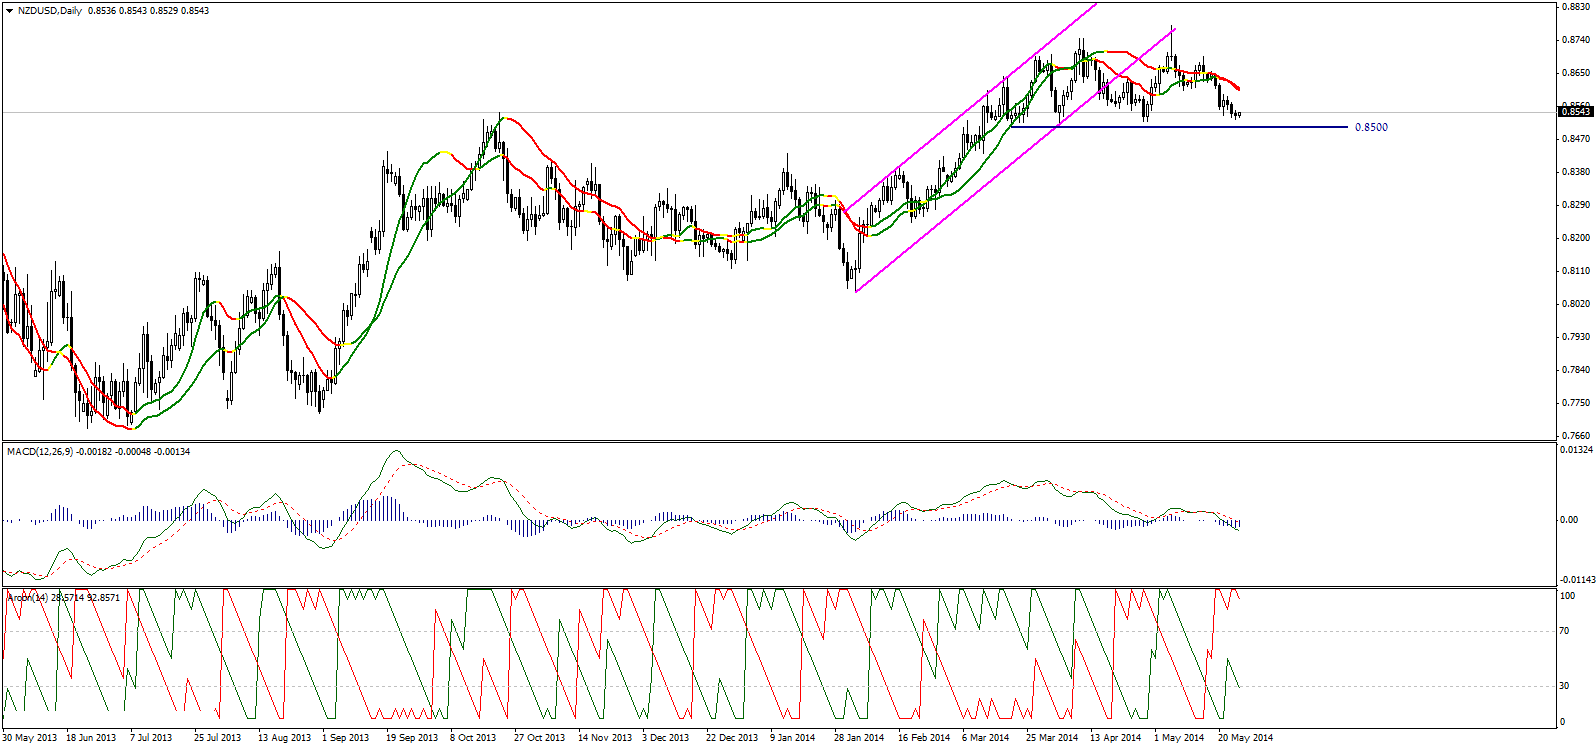
The pair is biased to the downside, however to confirm the extension of the downside move the pair must break and hold below 0.8500 areas. This level is technical support and psychological barrier for the pair this week. Over daily basis, we can see MACD negative and AROON signaling lower; Linear Regression Indicators are also trading with negative bias. Therefore, trading below 0.8700 is negative and stability below LRIs at 0.8610 is more bearish.
In general, as far as trading is below 0.8610 chances for a breakout below 0.8500 is likely and a breakout below this level might extend the downside move toward 0.8415 and maybe toward 0.8330 later.

