EUR/USD
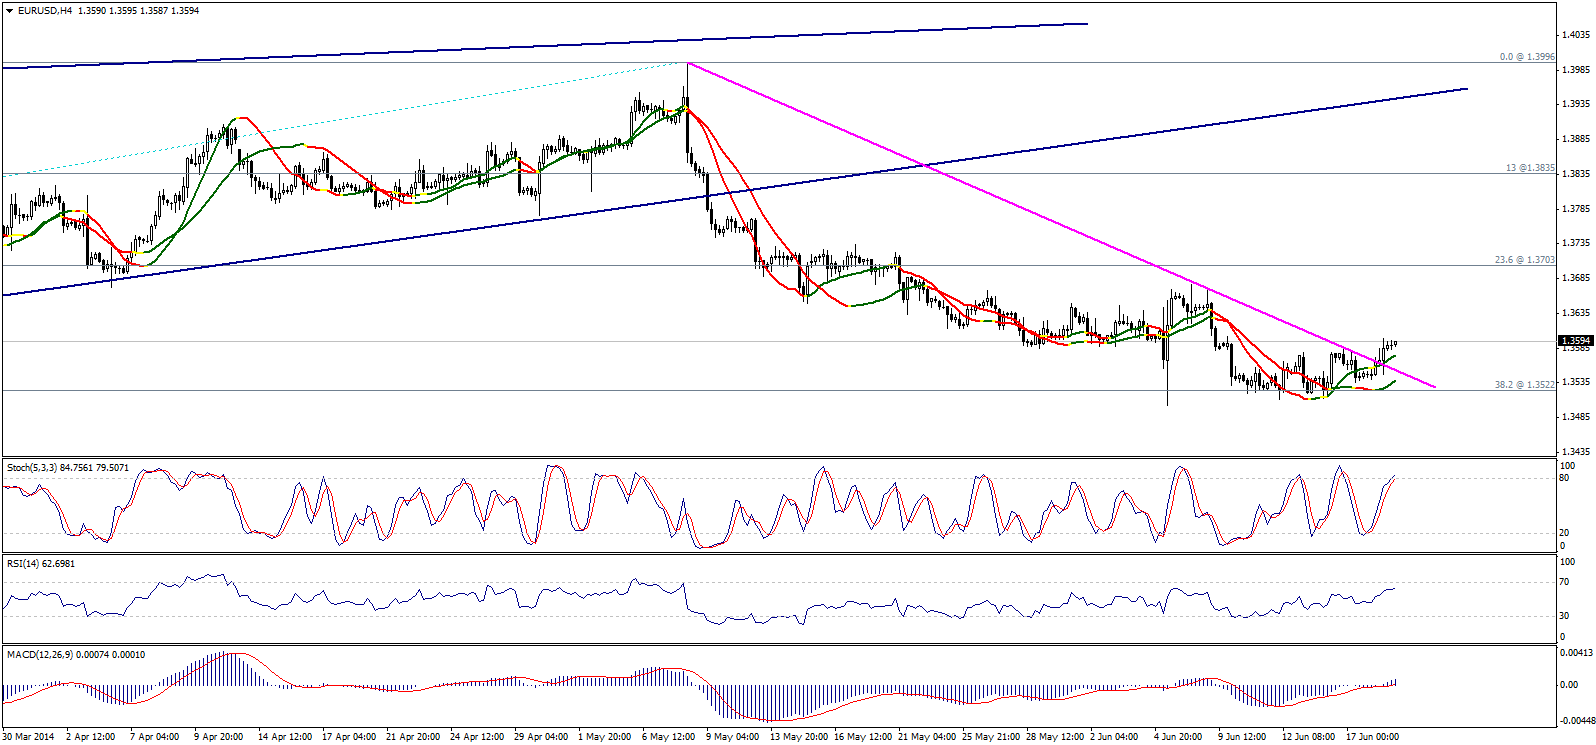
The pair broke above the key resistance level of the downside move that started from the top 1.3996 showing on graph, easing the way for further bullishness. Stabilizing above 1.3520 is positive and could extend the upside move.
But we should not ignore that the upside move and its extension depends today on the pair's ability to breach 1.3625, whereas failing to breach this level limit s the upside move and weaken it.

GBP/USD
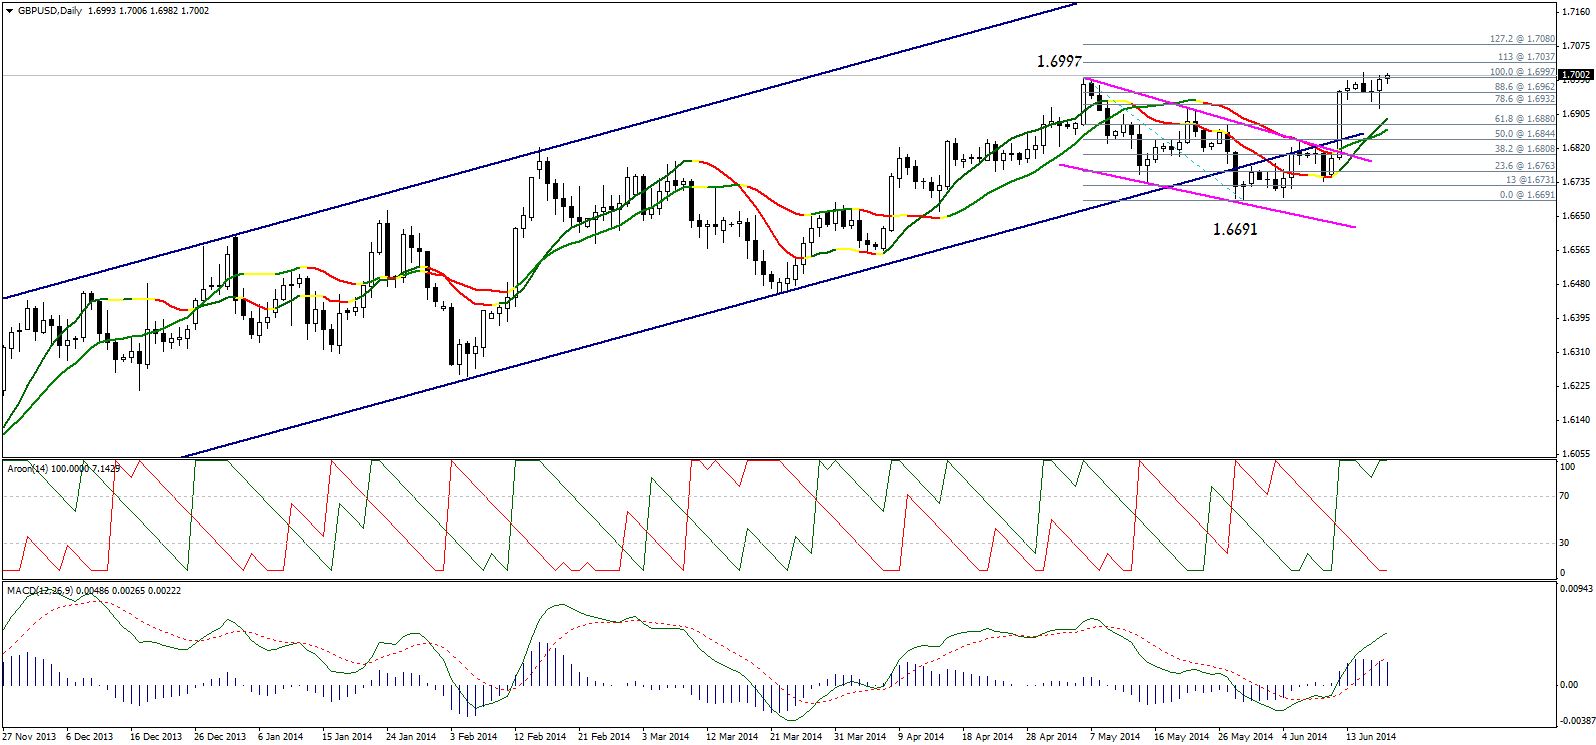
The pair inched higher after failing to stabilize below 1.6930 forming a bullish candle that brought positivity back, as we face today a new attempt to stabilize above the psychological barrier 1.7000.
The pair could attempt to touch Fibonacci levels 113% and 127.2% at 1.7040 and 1.7080 consecutively, and trading above 1.6930 keeps this possibility valid. The upside move depends on the pair's ability to stabilize above 1.7080, whereas breaching it triggers another bullish wave towards 1.7185.

USD/JPY
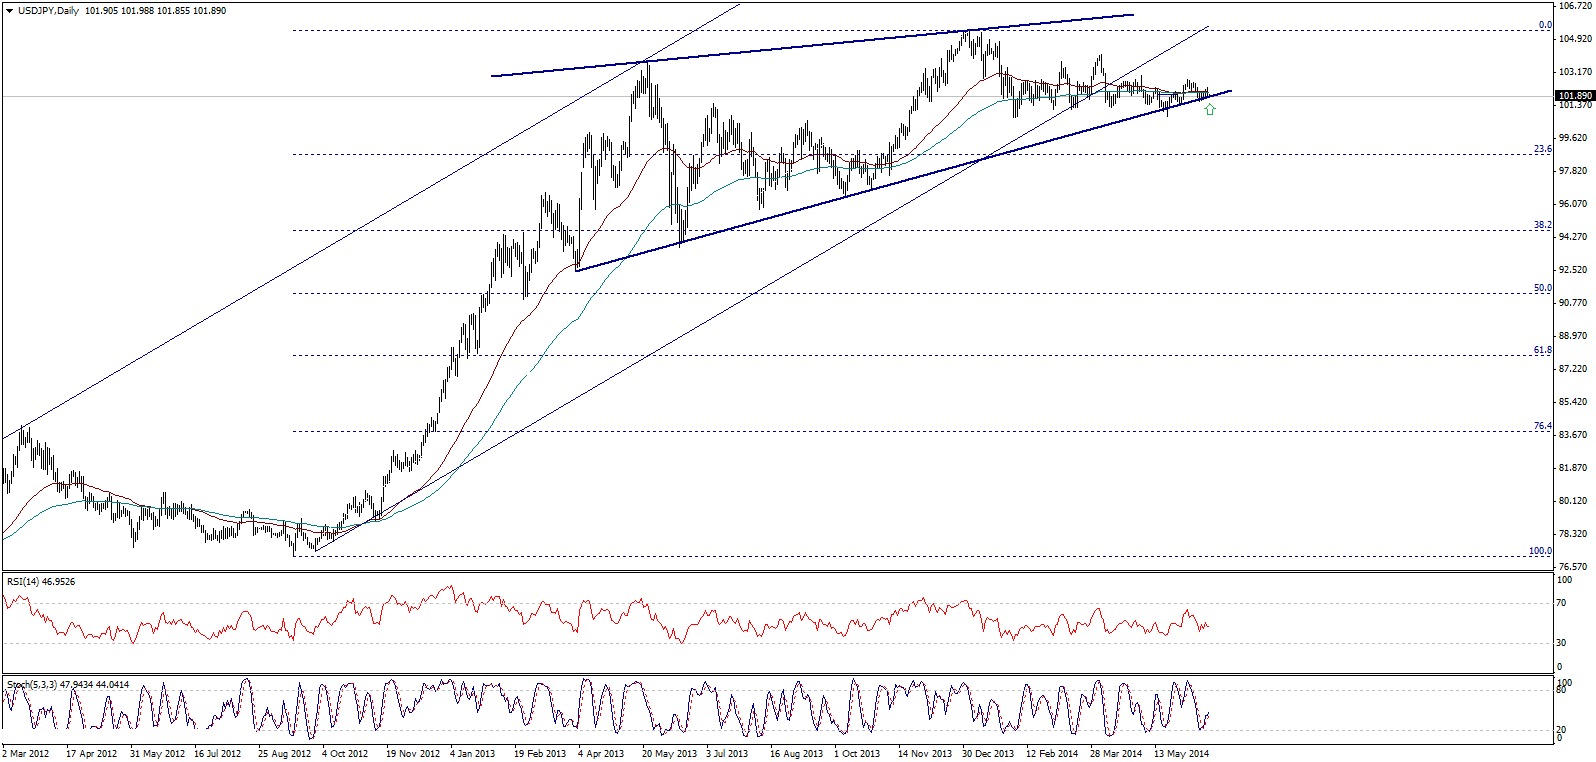
The pair is still fluctuating at the key support currently residing at 101.85, while Stochastic is providing positive signals supported by stabilizing above the latter encouraging us to still favor extending the upside move over short and intraday basis waiting to breach 102.10 to strengthen the possibilities of moving towards 104.45 then 105.40. Of note, breaking 101.85 pushes the pair towards 98.75 before any new attempt to the upside.

USD/CHF
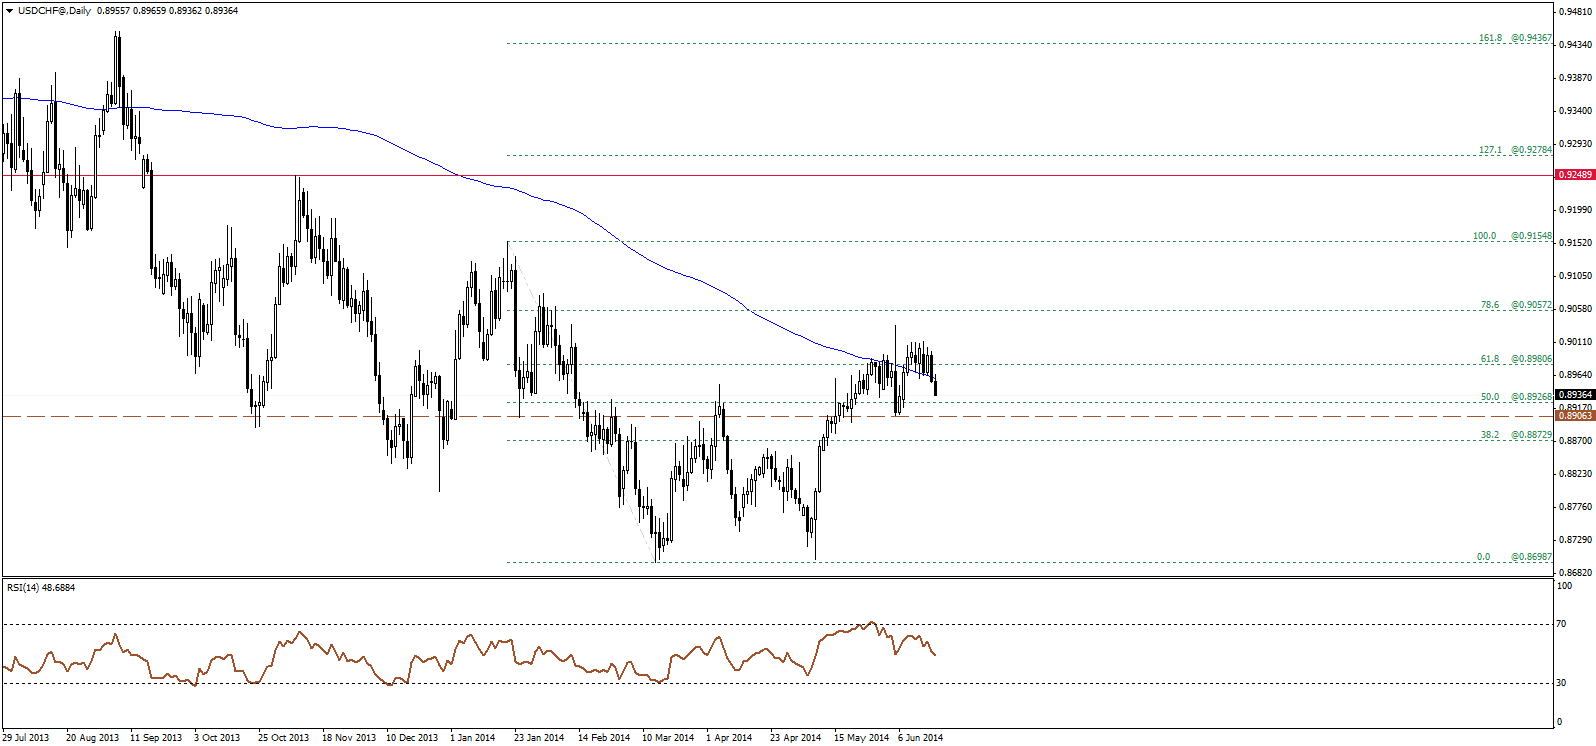
The USD/CHF is again under pressures, breaking back below the 200-days SMA and retesting the neckline area for the double bottom formation, among g0.8900-0.8950 area, accordingly, we prefer to move to the sidelines for now, awaiting a confirmation for a bullish rebound, or a break below 0.8900 which will signal a move lower towards 0.8850.

USD/CAD
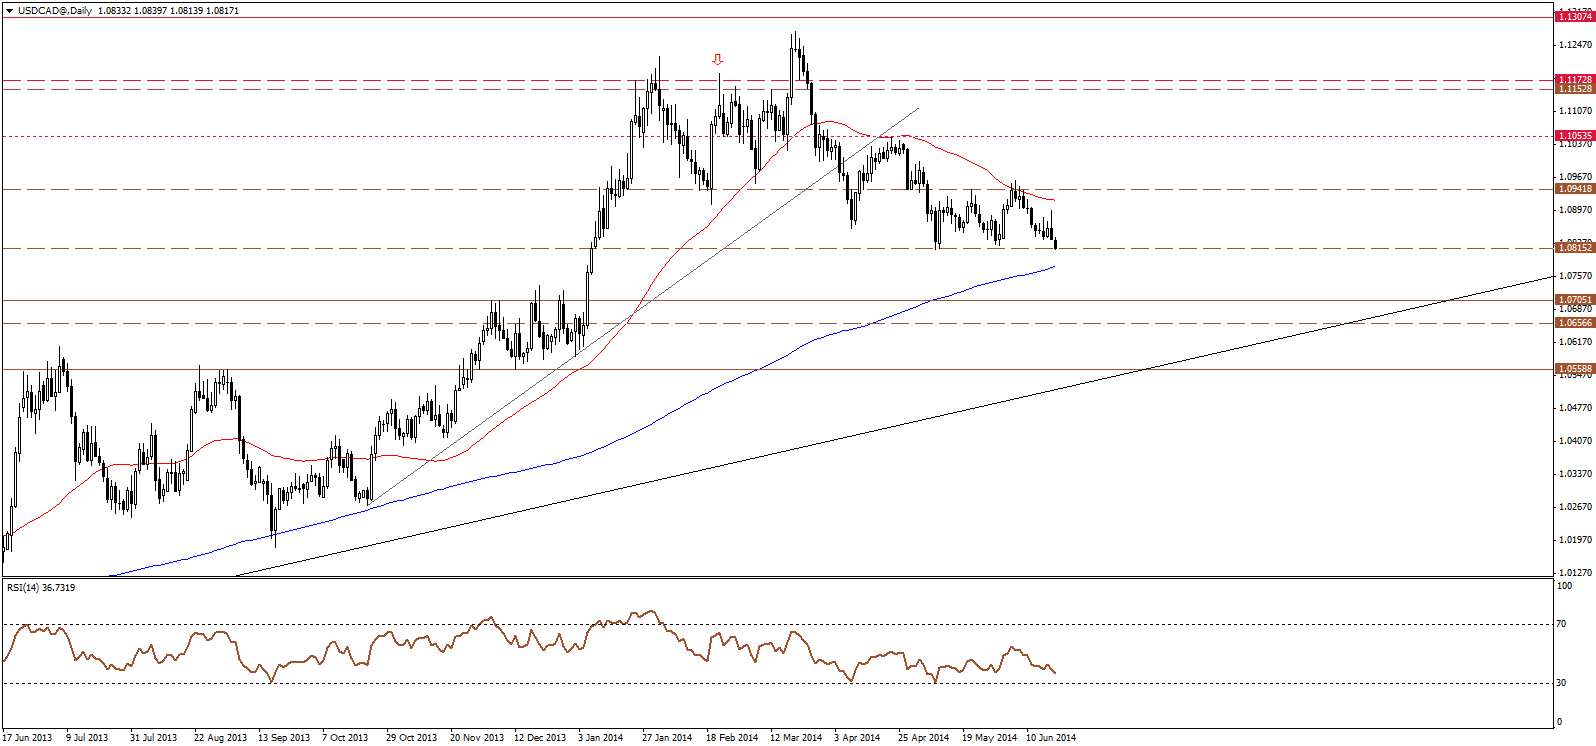
The USD/CAD resumed the bearish bias, retesting 1.0815 support level, where a break below this support will probably confirm the extension of the bearish wave, would signal the end of the sideways range among 1.0815-0.0940 levels, eying 1.0700 level as the next potential stop. Therefore, we favor the bearish scenario over intraday basis as long as price is holding below 1.0900.

AUD/USD
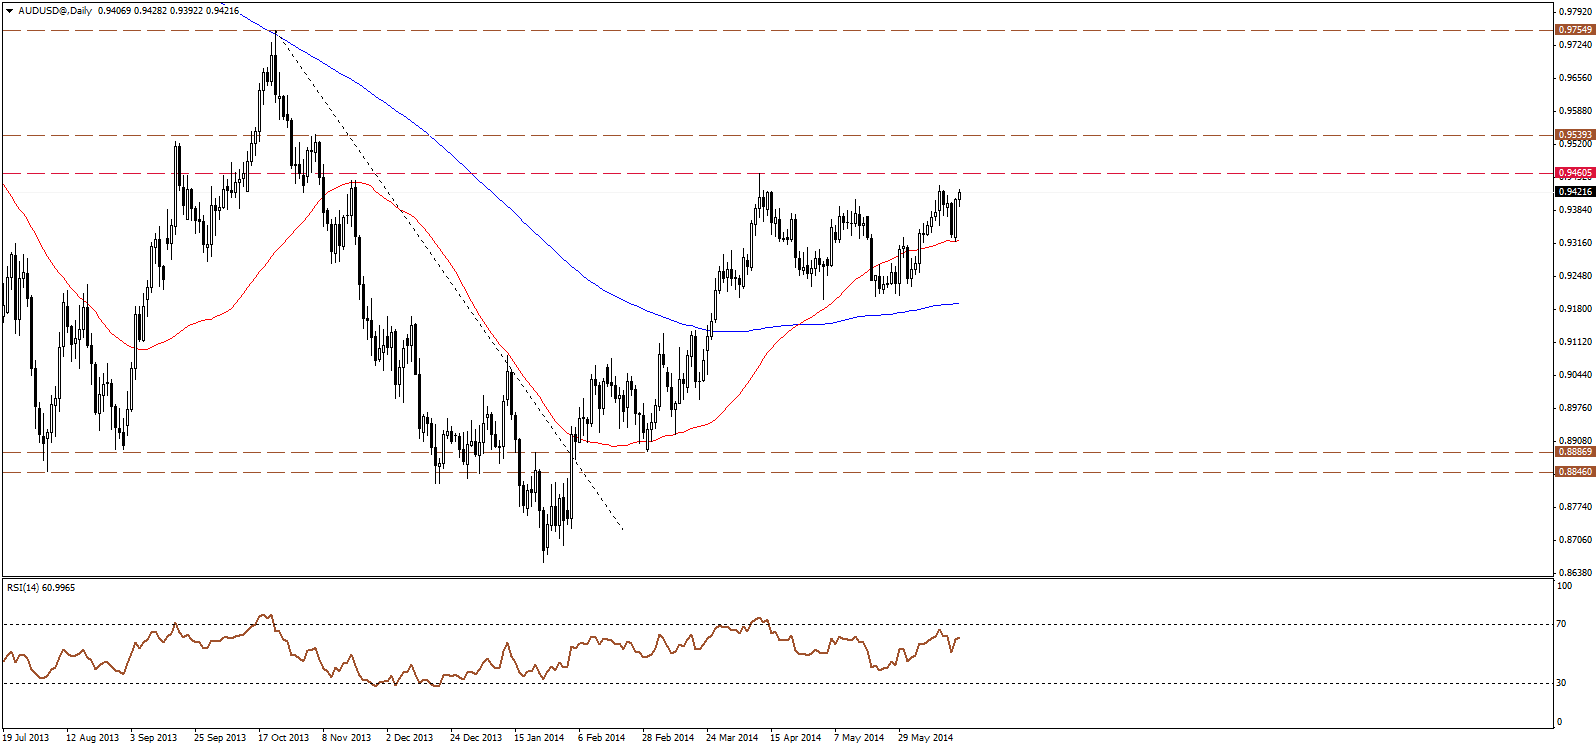
The AUD/USD rallies higher, after retesting the main support and the 50-days SMA around 0.9330 level, approaching the recent high and resistance area around 0.9450, where a break above the latter would confirm the resumption of the bullish trend that started from 0.8660 low, targeting 0.8540 as an initial upside target.

NZD/USD
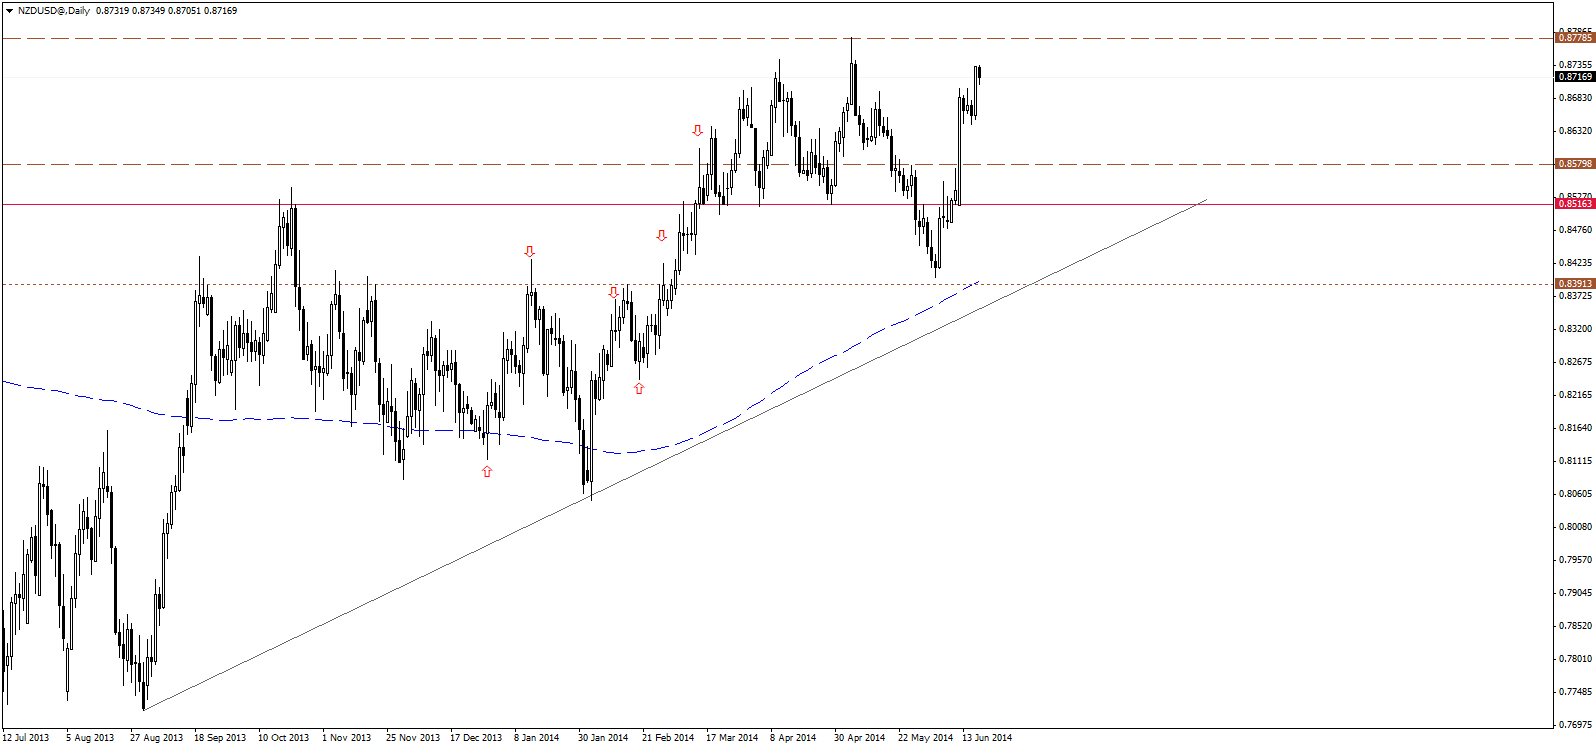
The NZD/USD broke higher, after completing a minor pullback in the form of a flag pattern, to extend the rally above 0.8700 level, forming a major bullish candle yesterday, where price approaches the main resistance at the recent highs near 0.8745 then 0.8780 levels. Overall, the bullish bias is expected to resume today from levels above 0.8700, and the bullish scenario will remain favored as long as above 0.8650.

