European Session
EUR/USD
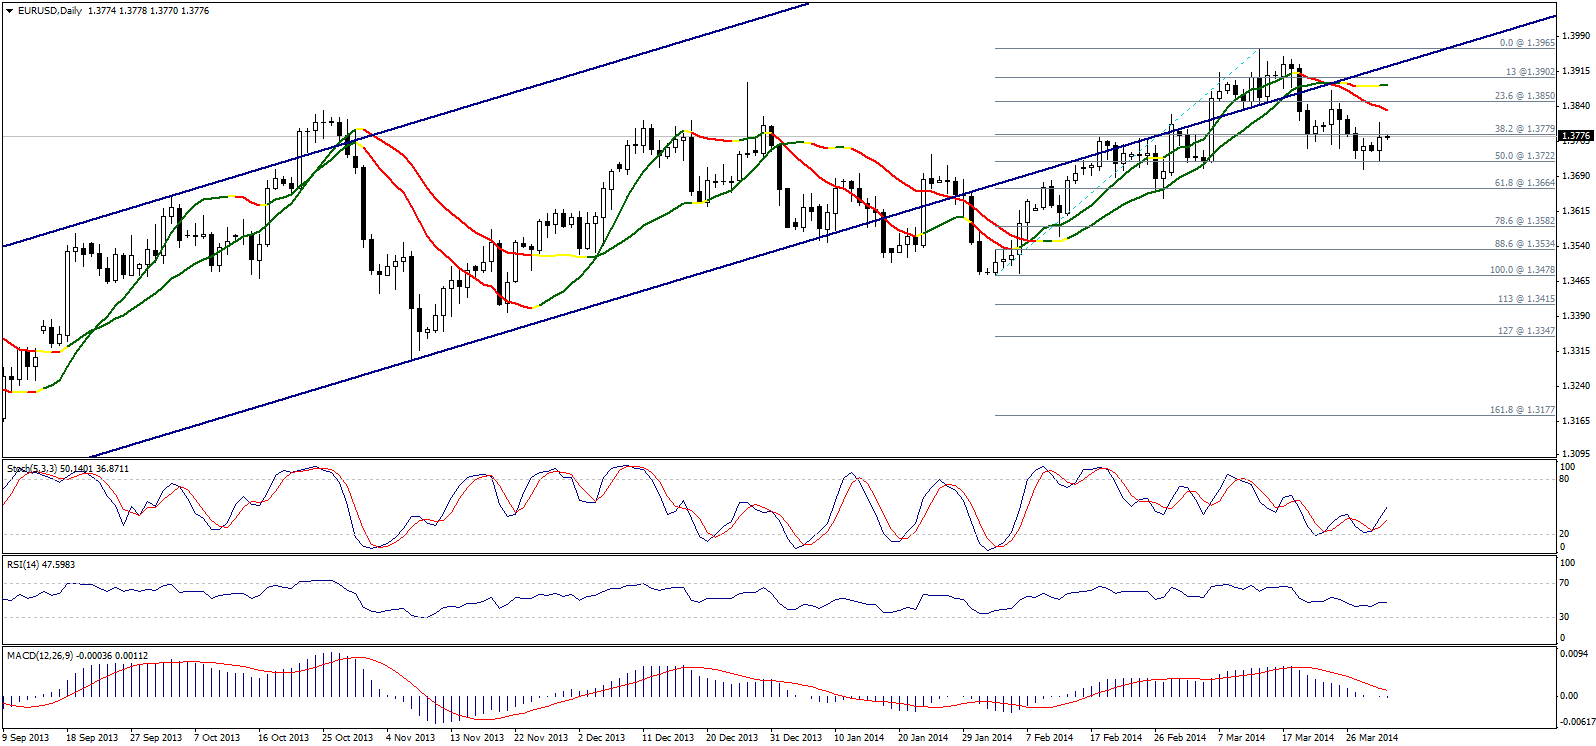
The pair managed to move to the uspide yesterday but is still limited below Linear Regression Indicators and below resistance level 1.3850. The daily closing was achieved below 38.2% correction at 1.3780 levels. Therefore, the bearish possibilityis still available especially with MACD trading line zero.
Yesterday's trading was based on 50% correction at 1.3720 as a floor, as these levels should be broken to confirm the downside move and cancel any possibility of responding to the positive signal showing on Stochastic. Generally, we will remain negative unless the pair breached 1.3850 levels and stabilized above it.

GBP/USD
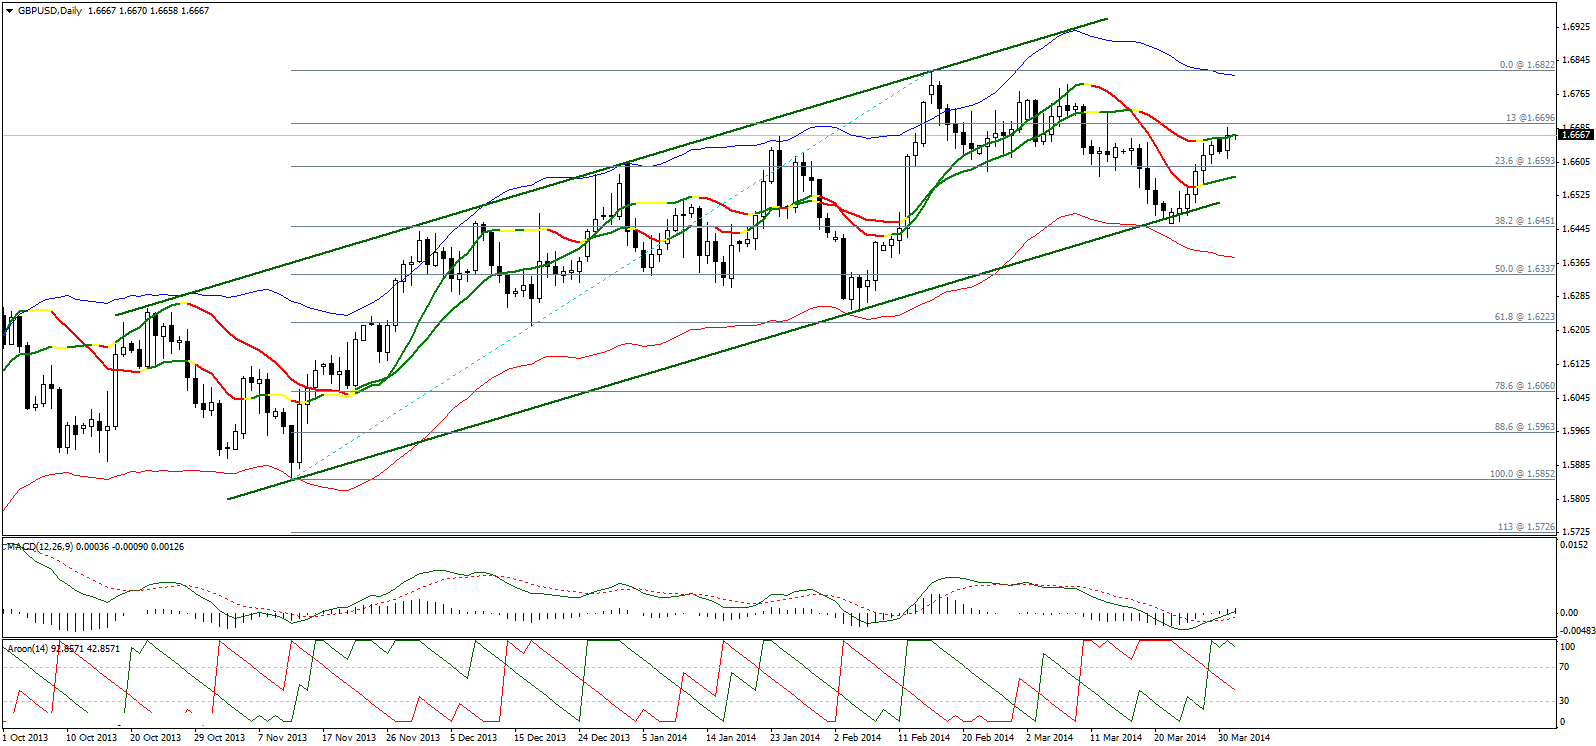
The pair inched higher yesterday and is traing around Linear Regression Indicator 55 with the beginning of today's European session. The bullish possibility is still available but Risk/Reward Ratios are inappropriate at these levels, as we will remain neutral despite expecting an attempt to breach 1.6695 levels.
AROON Indicator is still showing an upside move whiel MACD is still positive and attempts to breach line zero indicating continuing the positive attempts.

USD/JPY
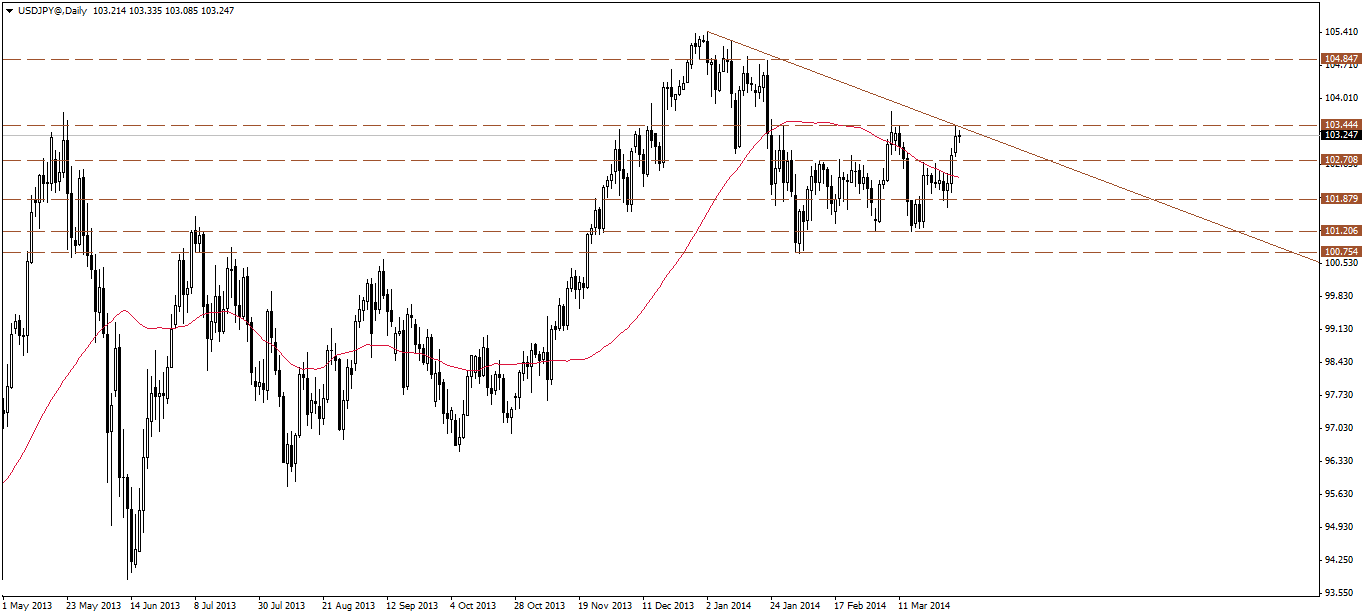
The USD/JPY settles at the main descending resistance shown on the daily chart above, in addition to 103.45-103.75 horizontal resistance level. A breakout above that resistance area is required to confirm more upside and clear the way to resuming the overall bullish trend, probably towards the major highs above 105.00. For now, we prefer to move to the sideline awaiting a confirmations signal.

USD/CHF
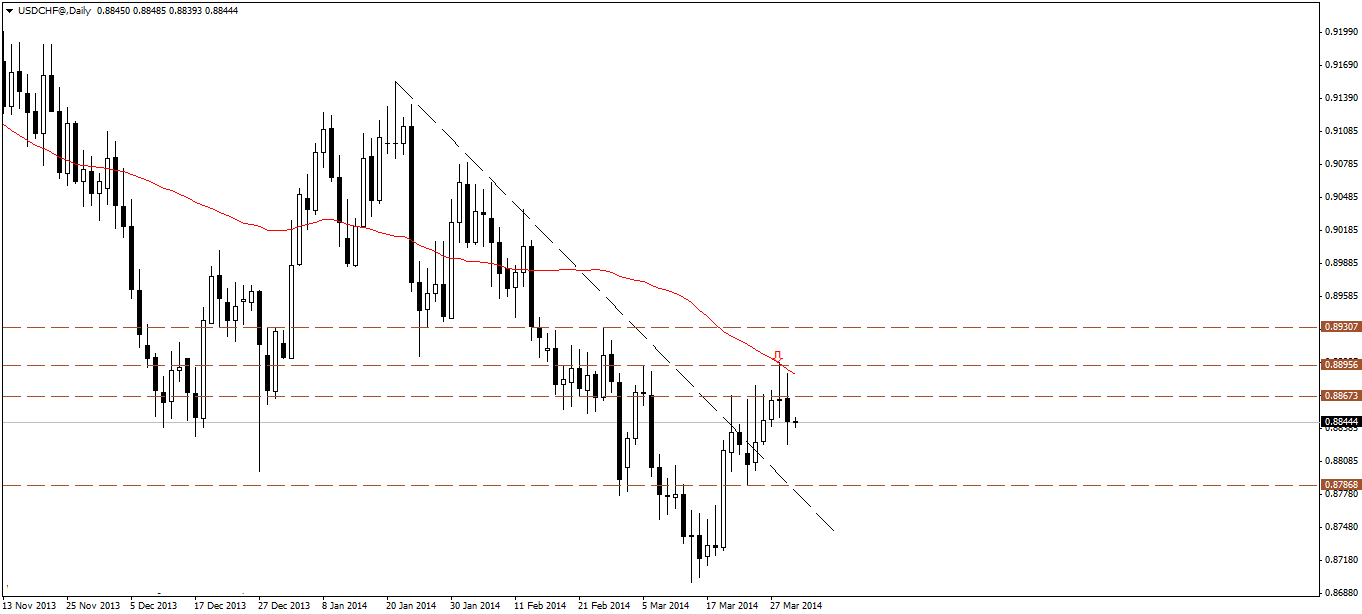
The USD/CHF formed a bearish candle below the 50-days SMA, following the earlier long legged doji candle as shown on the daily chart above, and that threatens for renewed bearish attempts in the near term, for a possible retest of 0.8785 support area.

USD/CAD
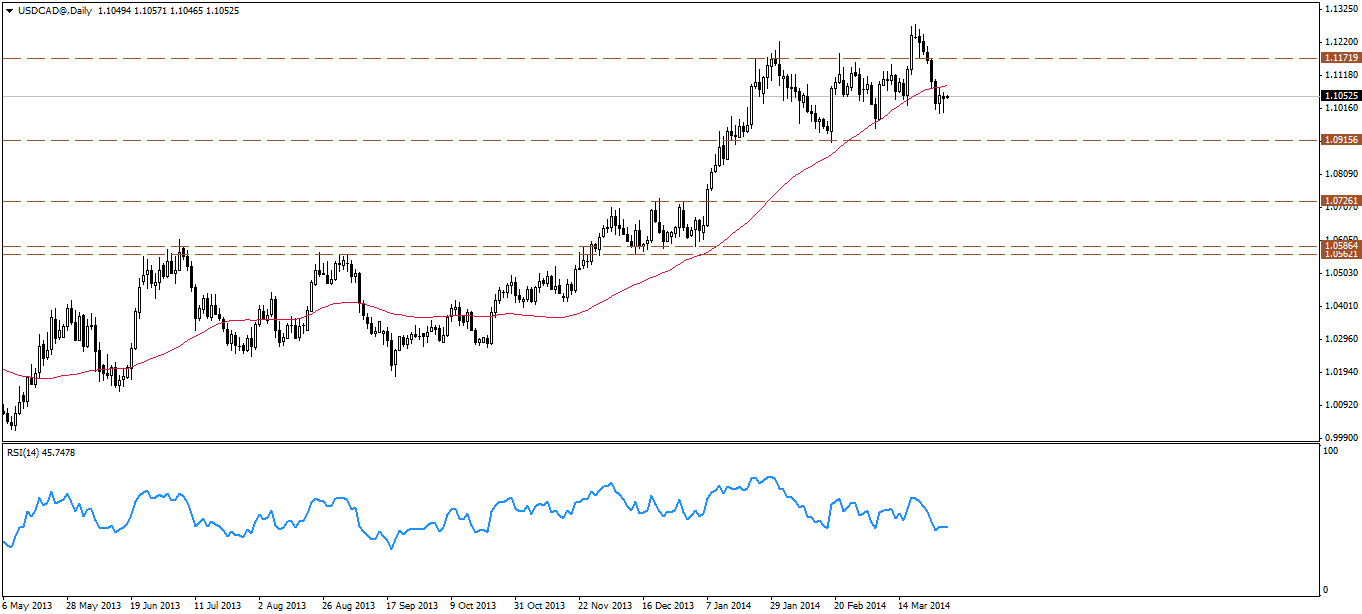
The USD/CAD fluctuated in sideways bias yesterday, below the 50-days SMA, where we still see further bearish attempts as long as price is holding below the average, targeting 1.0950 and 1.0915 levels . A break back above 1.1100 level may signal a new bullish attempt towards 1.1155 level..

AUD/USD
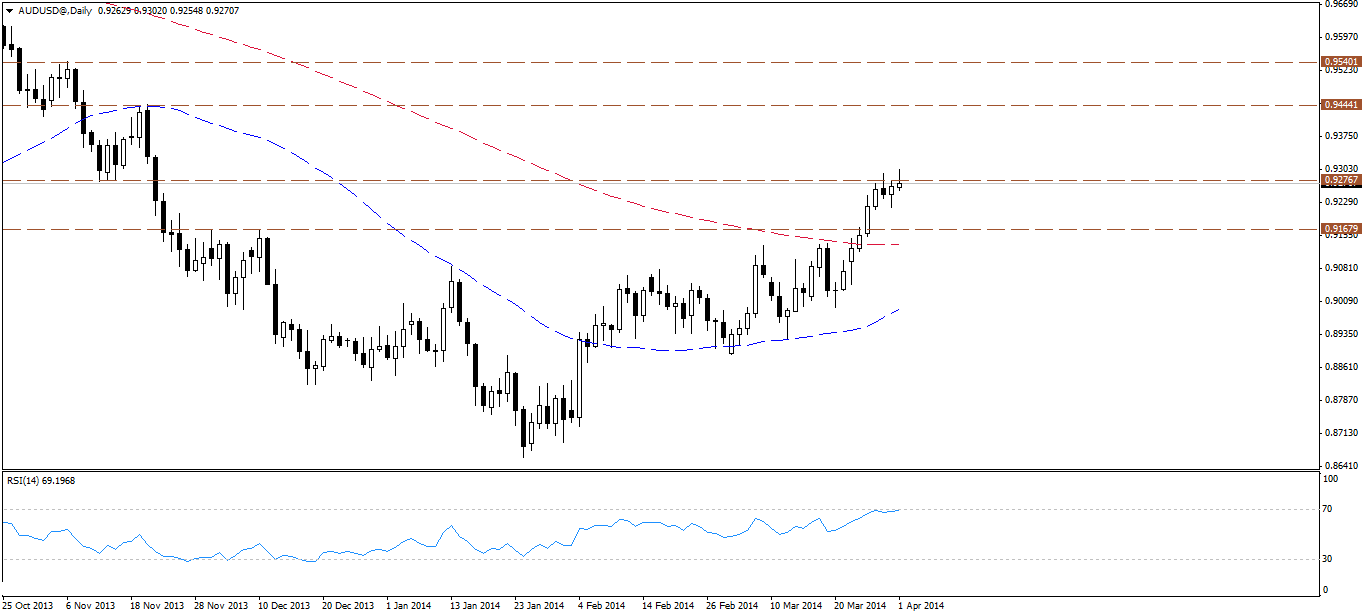
The AUD/USD fails so far to hold above 0.9275 resistance, as price fluctuates heavily around the level, holding above tha letter is necessary to confirm more short term upside. The bullish bias remains favored, but we prefer to wait for a confirmation. A break below yesterday’s low at 0.9220 will probably signal a deeper correction towards 0.9165-0.9150 area.

NZD/USD
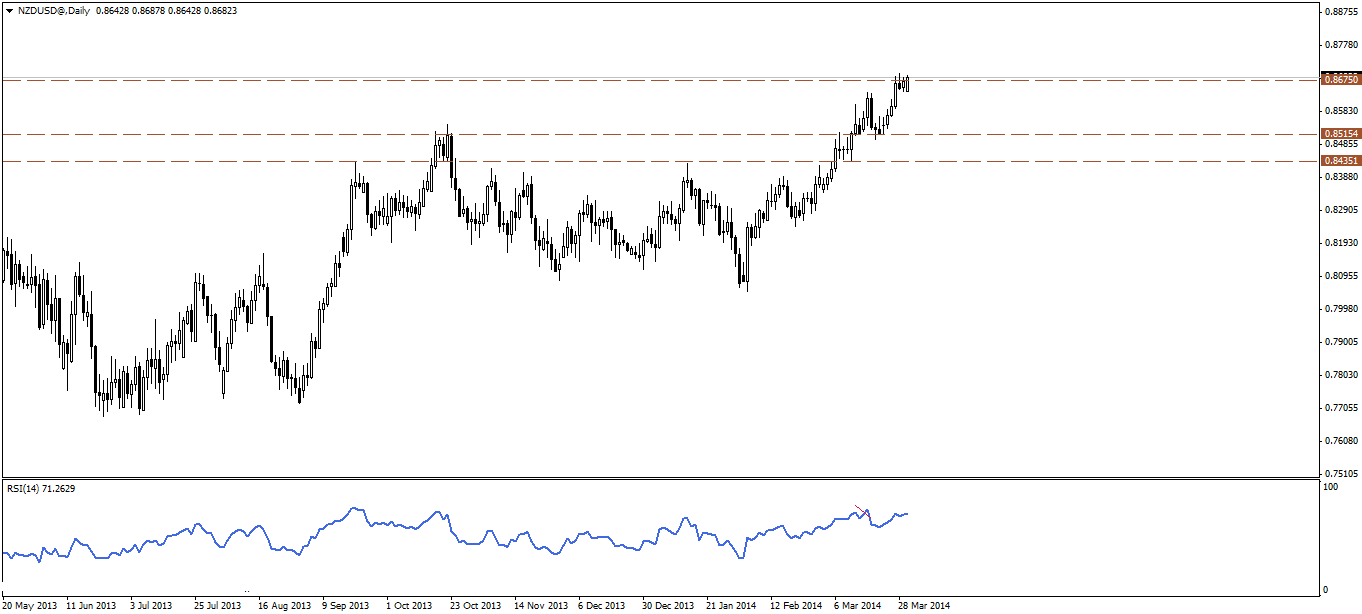
The NZD/USD is pushing higher again, however there still no break and stability above 0.8675 resistance level. The overall bullish bias is still favored, however we need a break above the latter to confirm the extension of the bullish wave without a deeper pullback, otherwise, if a pullback materials we will look to long the pair at lower levels.

