The Market
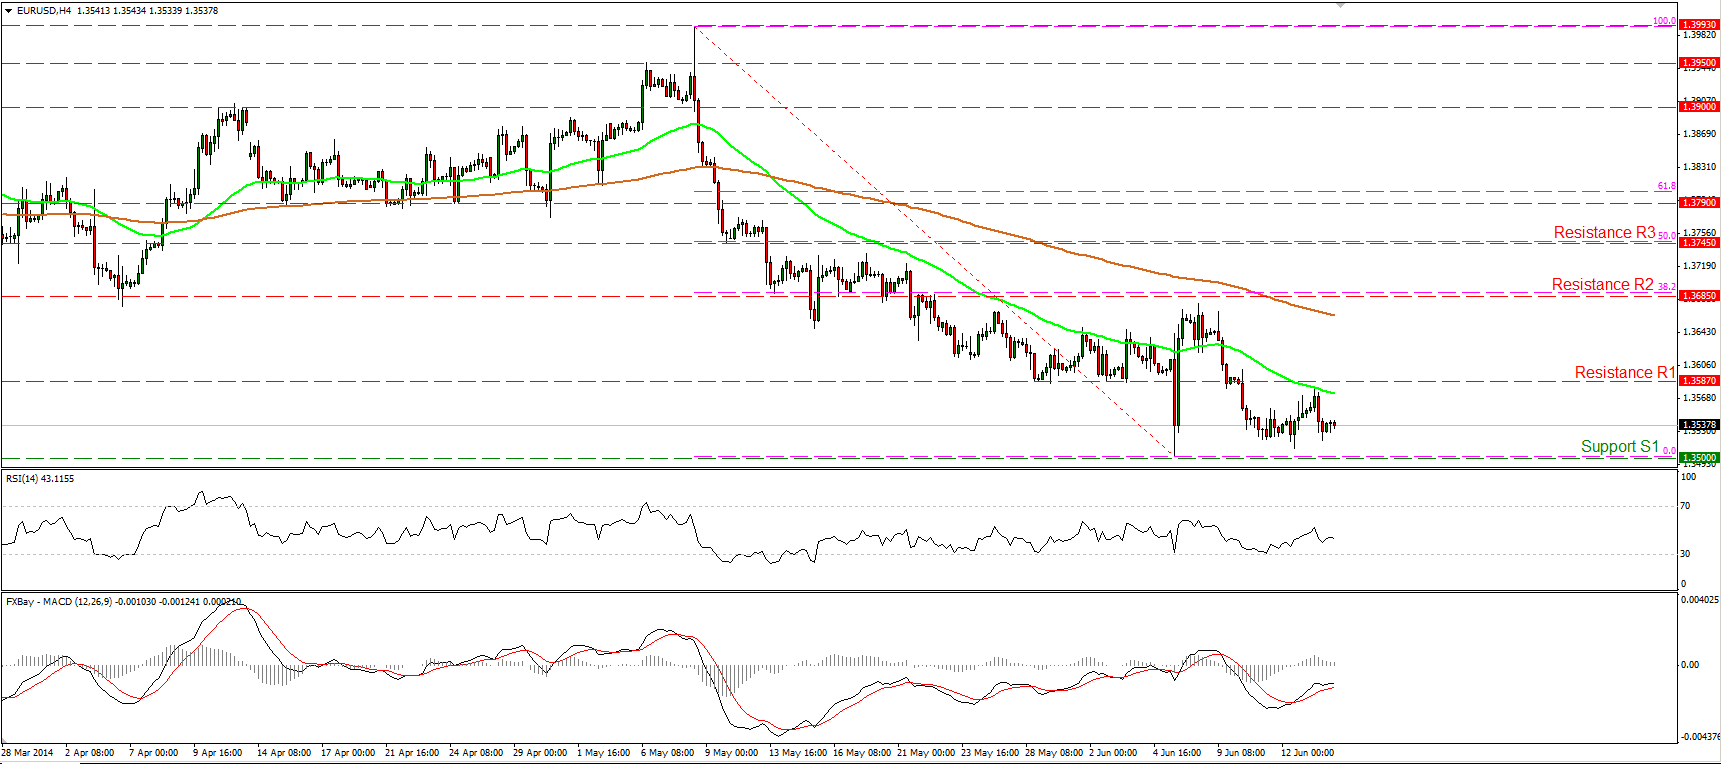
EUR/USD finds resistance at the 50-period MA
EUR/USD moved slightly lower after finding resistance at the 50-period moving average, slightly below the resistance barrier of 1.3587 (R1). The rate remains between the support of 1.3500 (S1) and the aforementioned resistance. The next support level is marked by the lows of February at 1.3475 (S2). Only a clear dip below that hurdle could signal the continuation of the short-term downtrend and may trigger extensions towards the 1.3400 (S3) zone. In the bigger picture, the rate remains below the 200-day moving average, keeping the outlook negative.
• Support: 1.3500 (S1), 1.3475 (S2), 1.3400 (S3).
• Resistance: 1.3587 (R1), 1.3685 (R2), 1.3745 (R3).
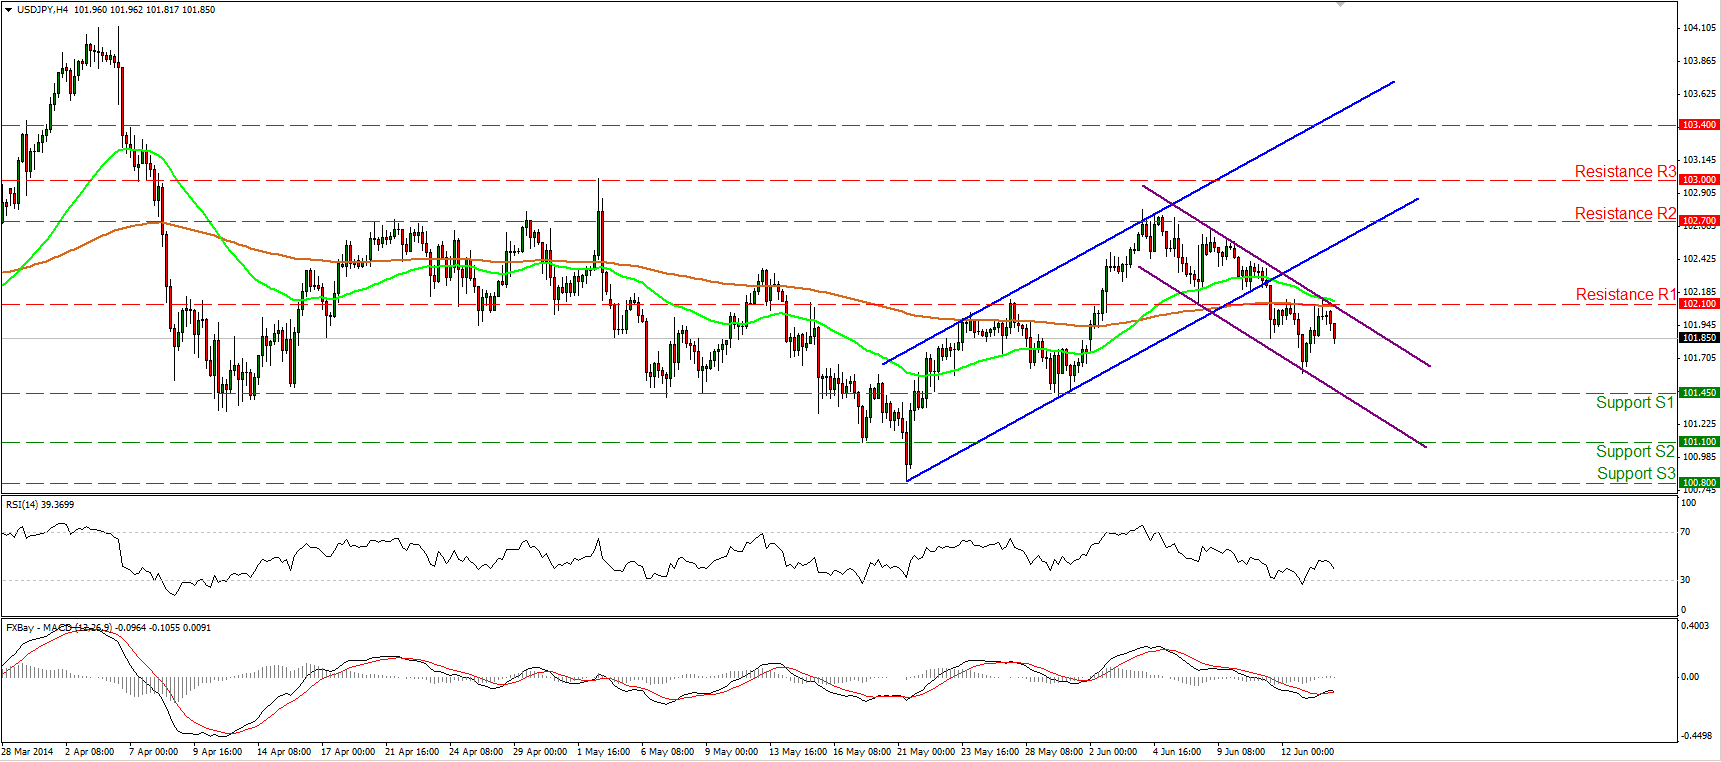
USD/JPY remains within the downtrend channel
USD/JPY moved higher on Friday, but met resistance at 102.10 (R1), near the 200-period moving average and the upper boundary of the purple downward sloping channel. If the bears are strong enough to maintain the rate below that resistance zone, I would expect them to challenge the support of 101.45. As long as the rate is printing lower highs and lower lows within the downtrend channel, I see a negative short-term picture. In the bigger picture, the longer-term path remains a trading range since we cannot identify a clear trending structure.
• Support: 101.45 (S1), 101.10 (S2), 100.80 (S3).
• Resistance: 102.10 (R1), 102.70 (R2), 103.00 (R3).
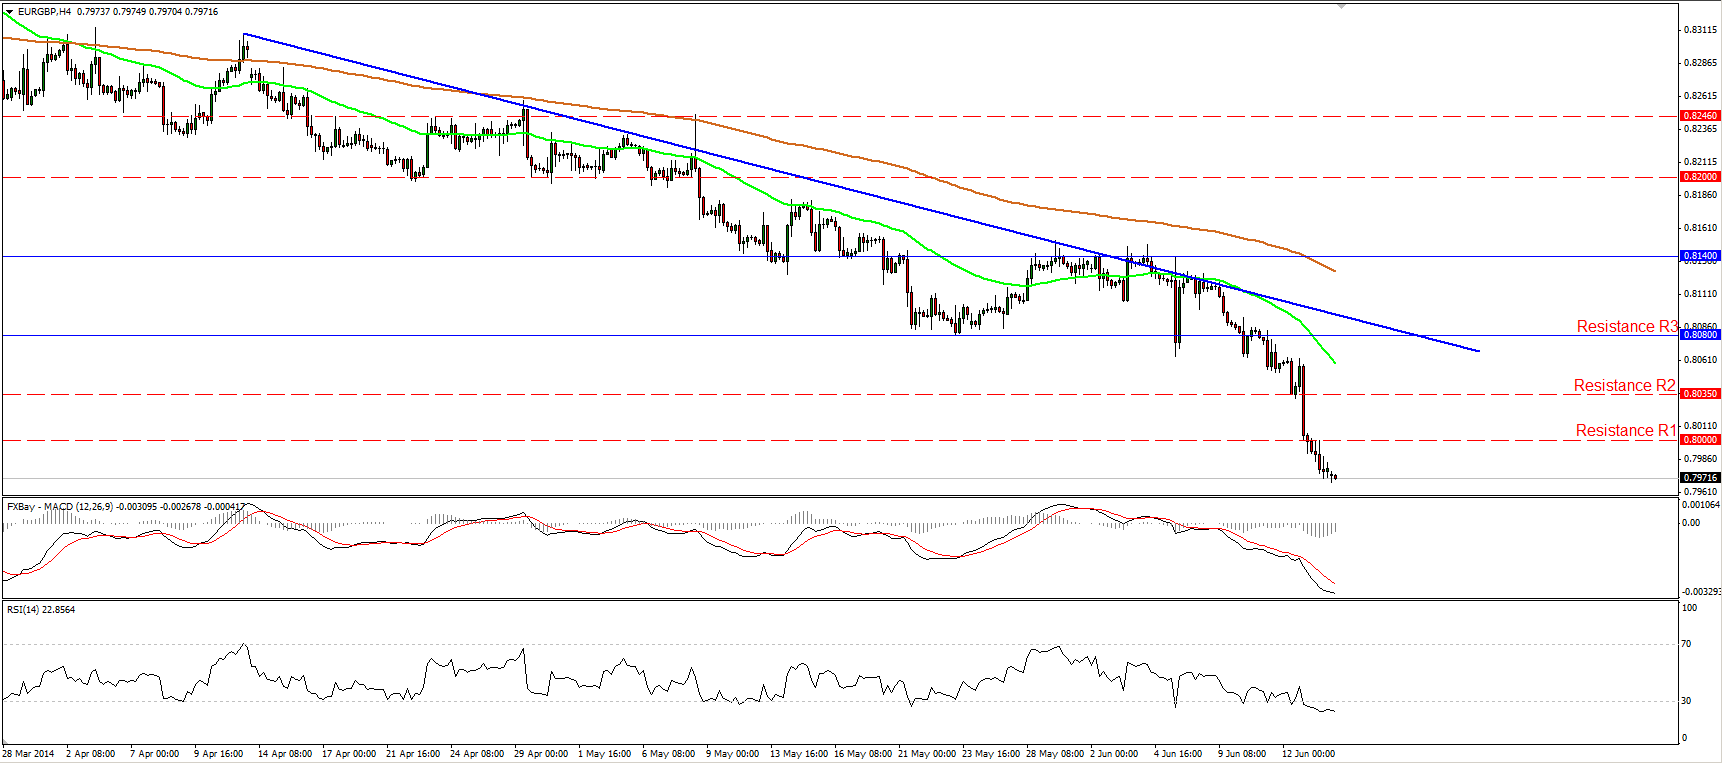
EUR/GBP breaks below 0.8000
EUR/GBP continued declining, breaking below the key zone of 0.8000. I would expect such a break to have larger bearish implications and pave the way towards the next support barrier at 0.7880 (S1). The MACD remains below both its trigger and zero lines, confirming the recent bearish momentum. I would ignore the oversold reading of RSI for now, since the oscillator is pointing down and I would expect an upside corrective wave upon its exit from the extreme zone. As long as the rate is trading below the blue downtrend line and below both the moving averages, I see a negative picture.
• Support: 0.7880 (S1), 0.7755 (S2), 0.7700 (S3).
• Resistance: 0.8000 (R1), 0.8035 (R2), 0.8080 (R3).
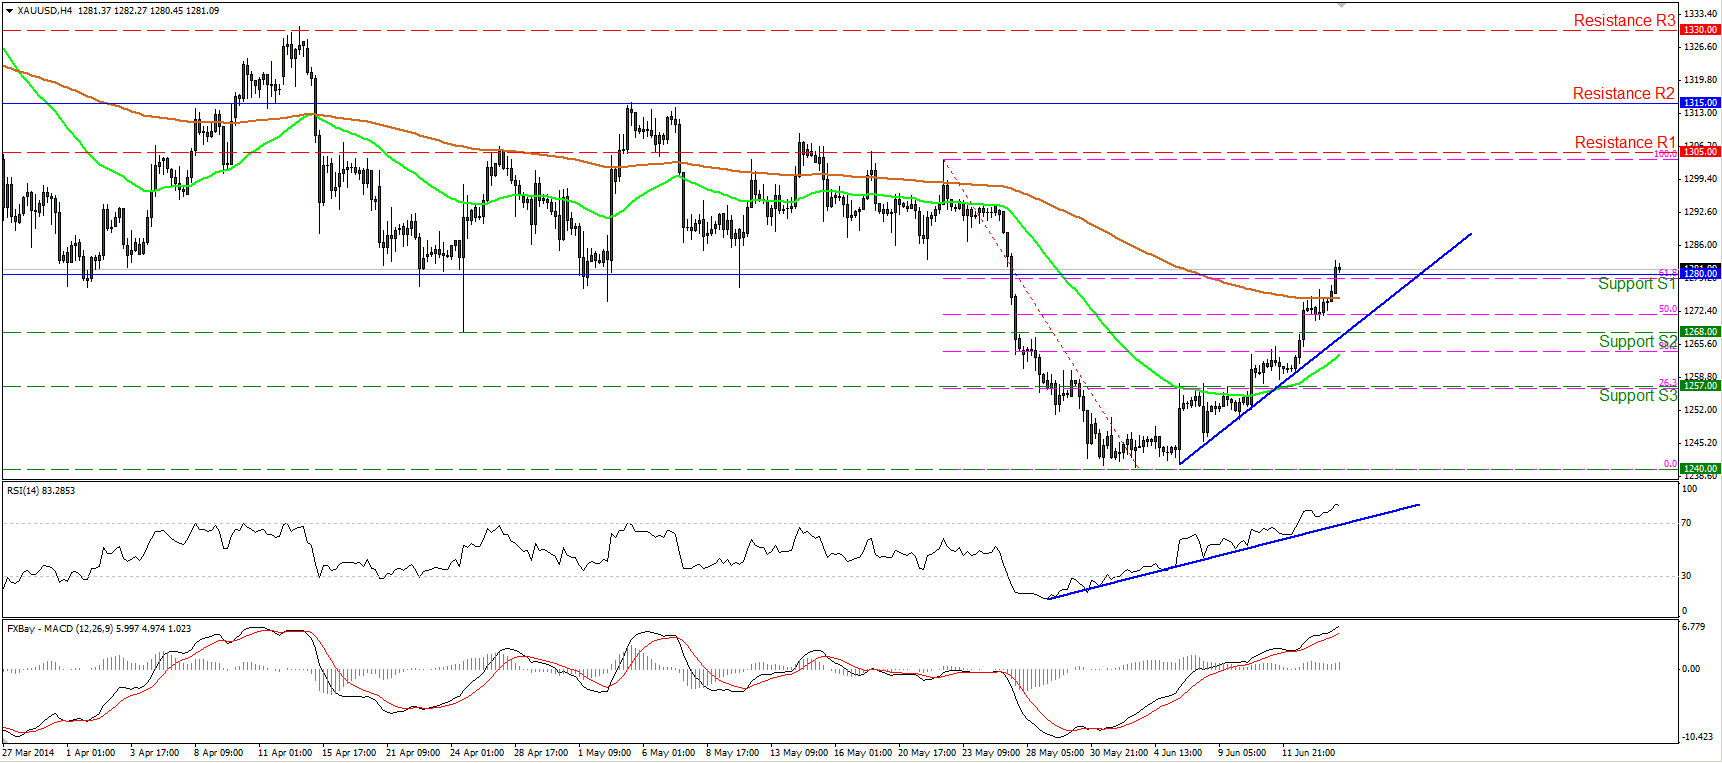
Gold continues higher
Gold continued moving higher, breaking above the 200-period moving average and above the 1280 barrier, which coincides with the 61.8% retracement level of the 22nd May – 3rd June decline. In my view, such a break could have larger bullish implications and could pave the way towards the resistance zone of 1305 (R2). The MACD remains above both its trigger and zero lines, while the RSI remains above its blue support line and does not seem willing to exit overbought conditions, at least for now. As long as the precious metal is forming higher highs and higher lows above the short-term blue uptrend line, I consider the short-term outlook to be positive.
• Support: 1268 (S1), 1257 (S2), 1240 (S3) .
• Resistance: 1280 (R1), 1305 (R2), 1315 (R3).
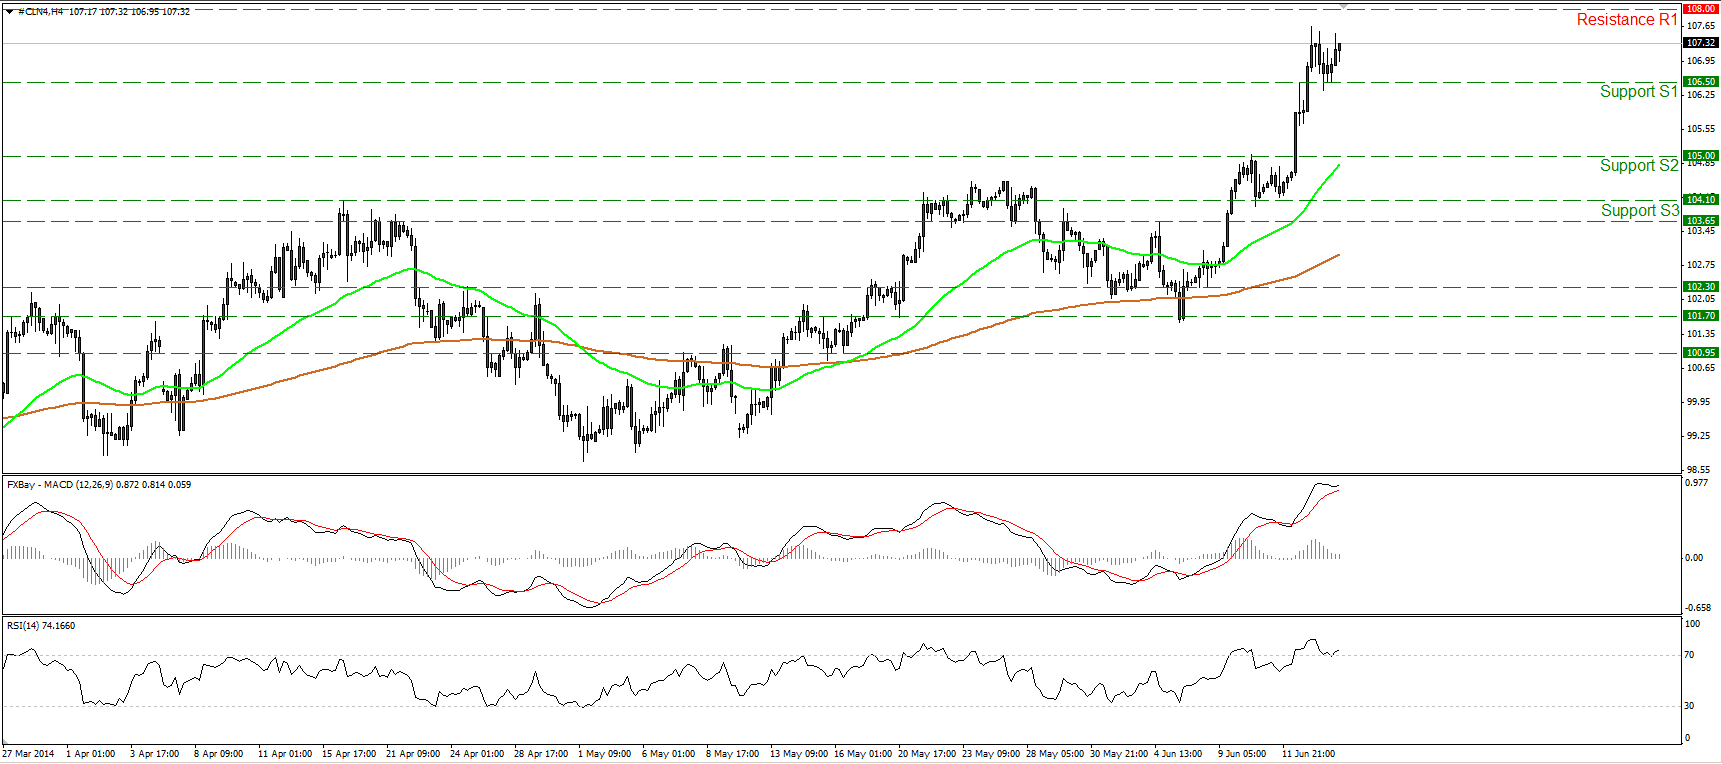
WTI heading towards the 108.00 zone
WTI moved higher after finding support at 106.50 (S1). The price is now heading towards the resistance zone of 108.00 (R1). I would expect WTI to challenge that zone, and if the bulls are strong enough to overcome it, they may trigger extensions towards the 110.00 (R2) area. The MACD remains above both its trigger and signal lines, while the RSI, already in its overbought zone, met support at its 70 level and moved slightly higher, confirming the recent strong bullish momentum of the price action.
• Support: 106.50(S1), 105.00 (S2), 104.10 (S3).
• Resistance: 108.00 (R1), 110.00 (R2), 112.00 (R3).

