Get 40% Off
💰 Buffett reveals a $6.7B stake in Chubb. Copy the full portfolio for FREE with InvestingPro’s Stock Ideas toolCopy Portfolio

Gold: Untypical Behavior

Published 03/31/2016, 09:39 AM
Updated 12/18/2019, 06:45 AM
XAU/USD
-
DX
-
GC
-
GLD
-

Untypical gold price behavior

Gold fell in price after Fed Chair Janet Yellen’s comments that there is no need to hurry with further interest rate hikes. Mid last December, the Fed raised rates from 0.125% to 0.375% for the first time in 9 years. The reaction of the precious metals market was uncharacteristic: the precious metals prices are edging down together with the US dollar index while they are usually negatively correlated. Will gold prices continue retreating?

The Fed funds futures price in a 46% chance of the interest rate hike in July, down from 51% on Monday before the Janet Yellen’s comments. The probability of the September rate hike fell to 56% from 63%, which triggered the global stock markets rally. Some investors may transfer their funds from gold into shares. The additional negative for precious metals were the unofficial US labor market data from ADP for March. Employment rose much more than expected. If the positive trend is supported by the official data on Friday, the chances for the US Fed interest rate hike may increase.

The 16% surge in gold prices in Q1 2016 was the highest since Q3 1986. Such explosive growth doesn’t rule out the possibility of technical downward correction. On Tuesday the stocks of the world major gold-backed SPDR Gold Shares (NYSE:GLD) ETF contracted by 3.3 tons for the first time in the last 2 weeks.
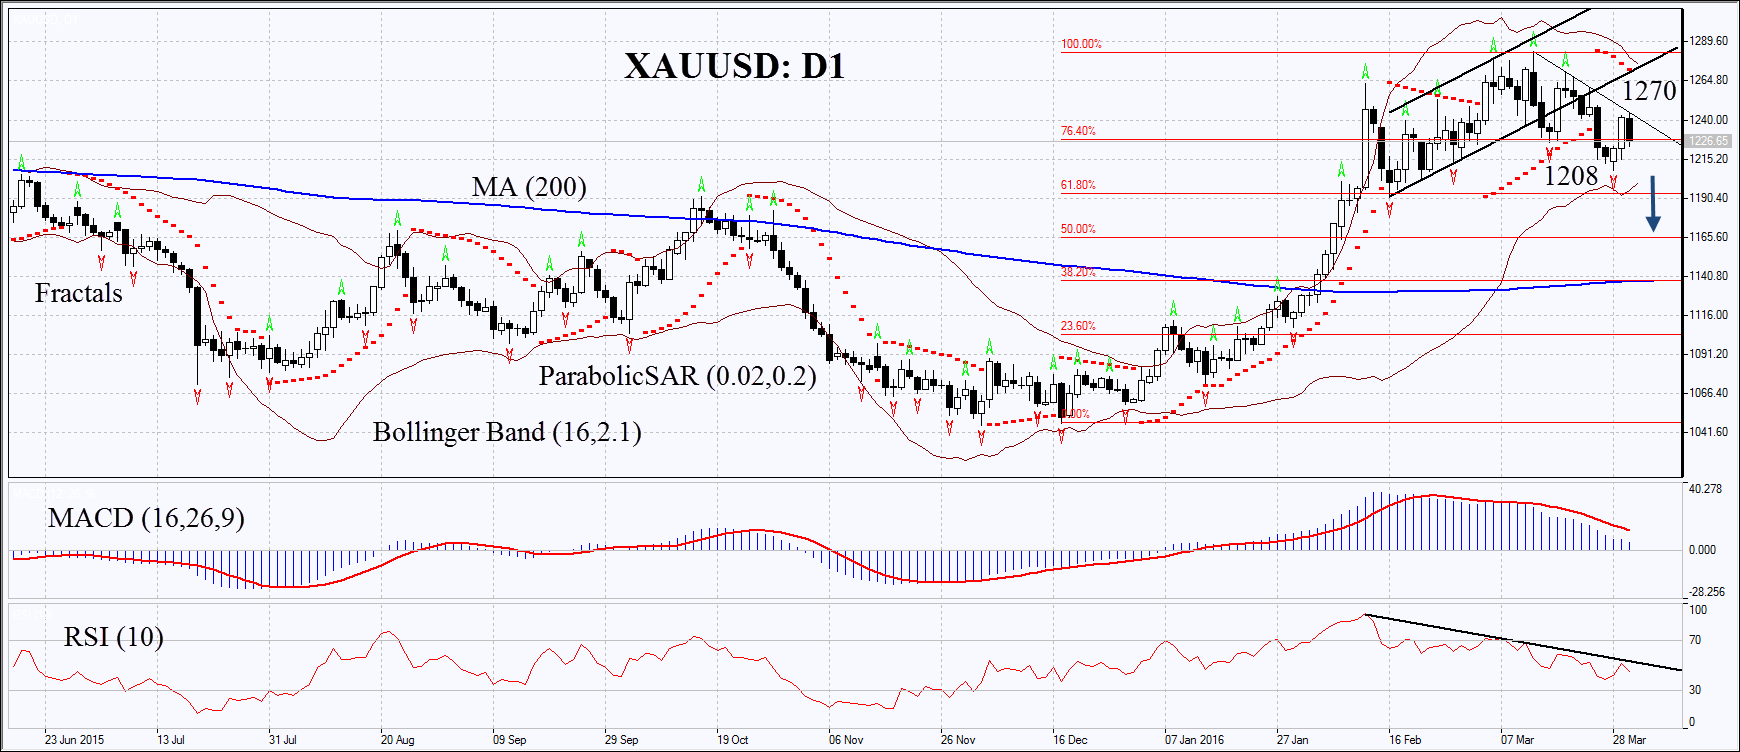
XAU/USD D1 Chart

On the daily chart XAU/USD: D1 has stopped moving sideways and begun correcting down from the year high. The MACD and Parabolic indicators give bearish signals. RSI has formed negative divergence and fallen below 50. The Bollinger bands have contracted, which means lower volatility. The bearish momentum may develop in case the gold price dips below the last fractal low at 1208. This level may serve the point of entry. The initial risk-limit may be placed above the Parabolic signal, Bollinger band and the last fractal high at 1270.

3rd party Ad. Not an offer or recommendation by Investing.com. See disclosure here or remove ads .

Having opened the pending order, we shall move the stop to the next fractal high following the Parabolic and Bollinger signals. Thus, we are changing the probable profit/loss ratio to the breakeven point. The most risk-averse traders may switch to the 4-hour chart after the trade and place a stop-loss there, moving it in the direction of the trade. If the price meets the stop-loss level at 1270 without reaching the order at 1208, we recommend cancelling the position: the market sustains internal changes which were not taken into account.

Position: Sell

Sell stop: Below 1208

Stop loss: Above 1270

Latest comments

I also remember there was a well documented visit by CNBC's Bob Pisani to GLD's gold vault. This visit was organized by GLD's management to prove the existence of GLD's gold but the gold bar held up by Mr. Pisani had the serial number ZJ6752 which did not appear on the most recent bar list at that time. It was later discovered that this "GLD" bar was actually owned by ETF Securities.
"On Tuesday the stocks of the world major gold-backed SPDR Gold Shares (NYSE:GLD) ETF...". . This is highly questionable. Paper gold GLD claims to be fully backed by physical gold bullion but yet it refuses to give your everyday investors the right to redeem for any of these ‘claimed’ gold bullion. This fact alone would mean GLD shares are nothing more than paper at the end of the day. Furthermore, GLD’s prospectus is chalk full of weasel clauses and legal loopholes that allows the fund to get away without the full physical gold backing. One good example of this is the clause that states GLD has no right to audit subcustodial gold holdings. To this day, I have not heard of a single good reason for the existence of this audit loophole.
Risk Disclosure: Trading in financial instruments and/or cryptocurrencies involves high risks including the risk of losing some, or all, of your investment amount, and may not be suitable for all investors. Prices of cryptocurrencies are extremely volatile and may be affected by external factors such as financial, regulatory or political events. Trading on margin increases the financial risks.
Before deciding to trade in financial instrument or cryptocurrencies you should be fully informed of the risks and costs associated with trading the financial markets, carefully consider your investment objectives, level of experience, and risk appetite, and seek professional advice where needed.
Fusion Media would like to remind you that the data contained in this website is not necessarily real-time nor accurate. The data and prices on the website are not necessarily provided by any market or exchange, but may be provided by market makers, and so prices may not be accurate and may differ from the actual price at any given market, meaning prices are indicative and not appropriate for trading purposes. Fusion Media and any provider of the data contained in this website will not accept liability for any loss or damage as a result of your trading, or your reliance on the information contained within this website.
It is prohibited to use, store, reproduce, display, modify, transmit or distribute the data contained in this website without the explicit prior written permission of Fusion Media and/or the data provider. All intellectual property rights are reserved by the providers and/or the exchange providing the data contained in this website.
Fusion Media may be compensated by the advertisers that appear on the website, based on your interaction with the advertisements or advertisers.
© 2007-2024 - Fusion Media Limited. All Rights Reserved.