Awaiting important economic data
Important economic data will come out in Japan on Friday: trade balance and current account balance for May. We believe the preliminary forecasts are negative. Will it push down the yen? On chart it will look as growth.
May inflation data came out in Japan last week. It fell for the 3rd straight month which means deflation. The BoJ head Haruhiko Kuroda in its speech on Thursday may hint on further plans of monetary stimulus of the economy. The Bank of Japan aims at 2% inflation till March 2018. Monetary stimulus is affected by issuing yen and cutting rates and may weigh on Japanese currency. Another factor is expected decline in positive trade balance of Japan in May to 56bn yen from 697bn yen in April. Data are to come out on Friday.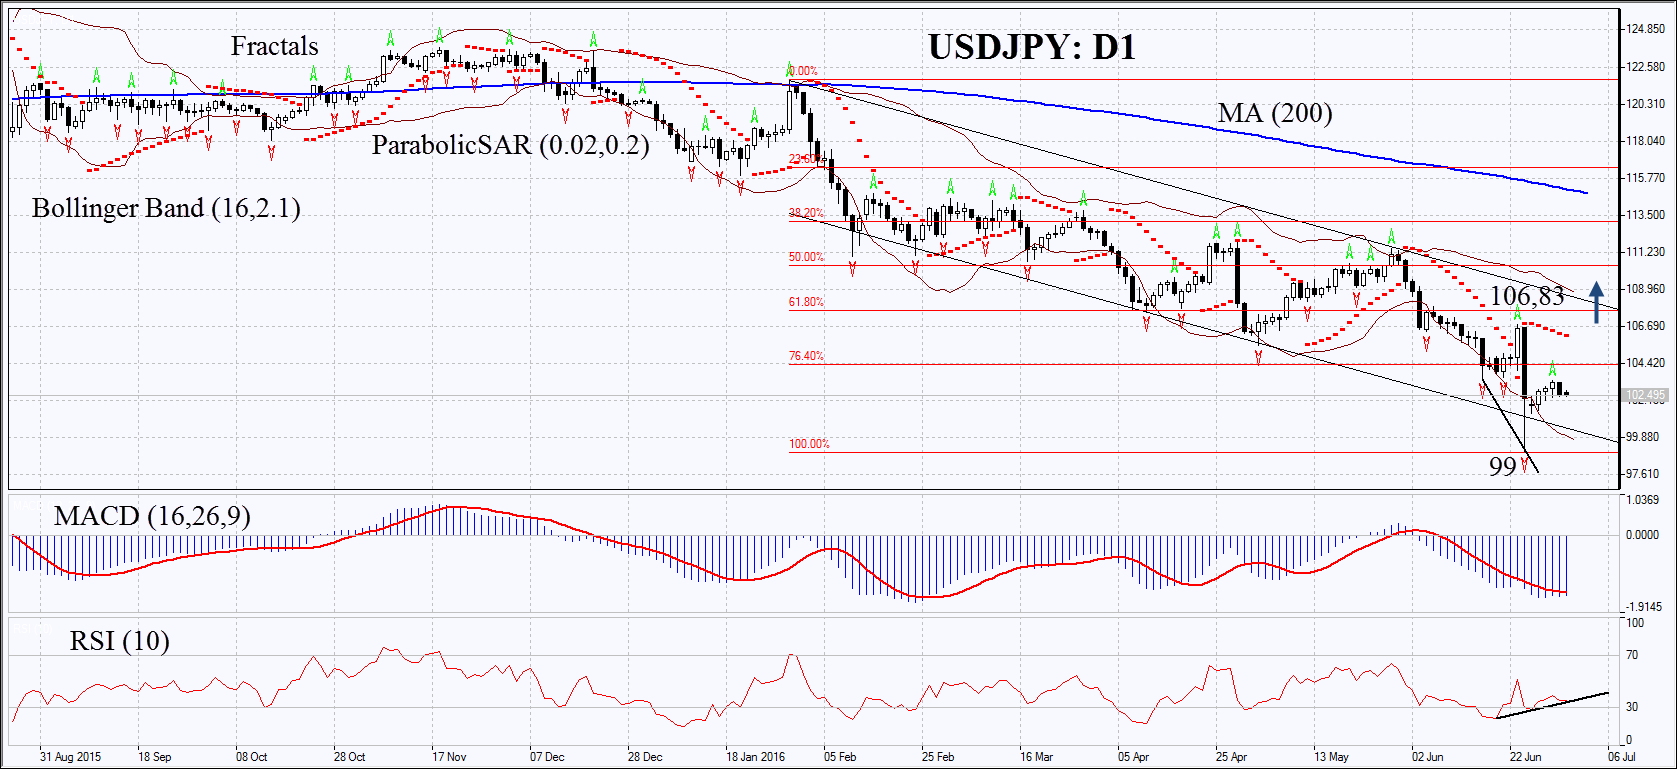
On the daily chart USDJPY: D1 has hit a fresh low since November 2013. The MACD and Parabolic indicators continue giving signals to sell. The Bollinger bands have widened which means higher volatility. RSI has left the oversold zone and formed positive divergence. The bullish momentum may develop in case the yen surpasses the 2nd fractal high and the Parabolic signal at: 106.83. This level may serve the point of entry. The initial stop-loss may be placed below the last fractal low and multi-month low at 99. Having opened the pending order we shall move the stop to the next fractal low following the Parabolic and Bollinger signals. Thus, we are changing the probable profit/loss ratio to the breakeven point. The most risk-averse traders may switch to the 4-hour chart after the trade and place there a stop-loss moving it in the direction of the trade. If the price meets the stop-loss level at 99 without reaching the order at 106.83, we recommend cancelling the position: the market sustains internal changes which were not taken into account.
PositionBuyBuy stopabove 106.83Stop lossbelow 99
- English (UK)
- English (India)
- English (Canada)
- English (Australia)
- English (South Africa)
- English (Philippines)
- English (Nigeria)
- Deutsch
- Español (España)
- Español (México)
- Français
- Italiano
- Nederlands
- Português (Portugal)
- Polski
- Português (Brasil)
- Русский
- Türkçe
- العربية
- Ελληνικά
- Svenska
- Suomi
- עברית
- 日本語
- 한국어
- 简体中文
- 繁體中文
- Bahasa Indonesia
- Bahasa Melayu
- ไทย
- Tiếng Việt
- हिंदी
Technical Analysis USDJPY : 2016-07-05
Published 07/05/2016, 08:28 AM
Updated 12/18/2019, 06:45 AM
Technical Analysis USDJPY : 2016-07-05

IFC Markets
3rd party Ad. Not an offer or recommendation by Investing.com. See disclosure here or
remove ads
.
Latest comments
Install Our App
Risk Disclosure: Trading in financial instruments and/or cryptocurrencies involves high risks including the risk of losing some, or all, of your investment amount, and may not be suitable for all investors. Prices of cryptocurrencies are extremely volatile and may be affected by external factors such as financial, regulatory or political events. Trading on margin increases the financial risks.
Before deciding to trade in financial instrument or cryptocurrencies you should be fully informed of the risks and costs associated with trading the financial markets, carefully consider your investment objectives, level of experience, and risk appetite, and seek professional advice where needed.
Fusion Media would like to remind you that the data contained in this website is not necessarily real-time nor accurate. The data and prices on the website are not necessarily provided by any market or exchange, but may be provided by market makers, and so prices may not be accurate and may differ from the actual price at any given market, meaning prices are indicative and not appropriate for trading purposes. Fusion Media and any provider of the data contained in this website will not accept liability for any loss or damage as a result of your trading, or your reliance on the information contained within this website.
It is prohibited to use, store, reproduce, display, modify, transmit or distribute the data contained in this website without the explicit prior written permission of Fusion Media and/or the data provider. All intellectual property rights are reserved by the providers and/or the exchange providing the data contained in this website.
Fusion Media may be compensated by the advertisers that appear on the website, based on your interaction with the advertisements or advertisers.
© 2007-2024 - Fusion Media Limited. All Rights Reserved.