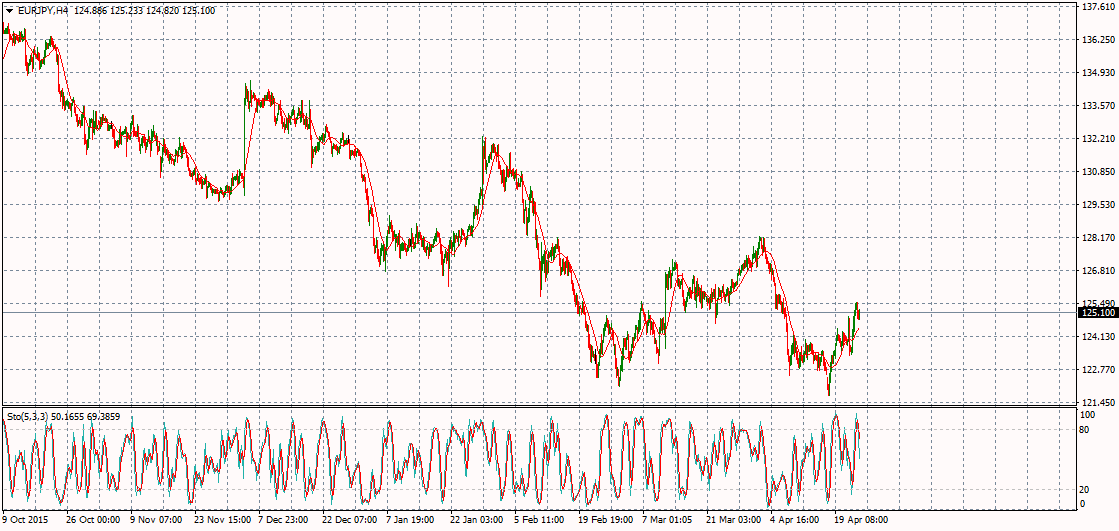
The EUR/JPY pair confirmed, breaching 124.60, followed by the 125.00 barrier after closing the weekly candlestick above them, which supports the continuation of the expected bullish trend for the upcoming period. It is now targeting 127.10 followed by 128.65.
Note that holding above 123.15 is the main condition to continue the expected bullish trend and achieve the above mentioned targets.
Expected trading range for today is between 124.00 and 126.00.
Expected trend for today: Bullish
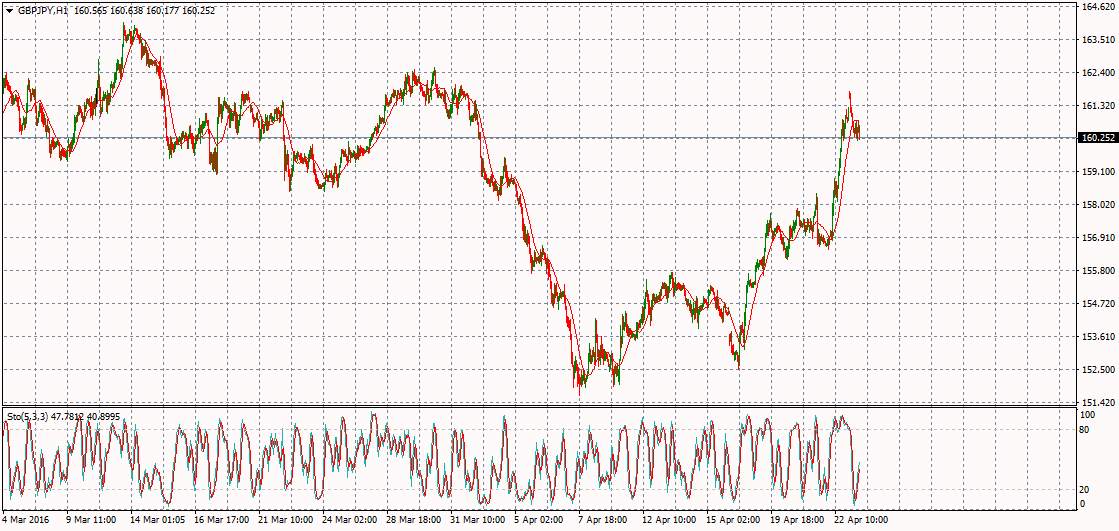
The GBP/JPY pair breached the bearish channel’s resistance and settled above it, which turns the intraday and short-term trading to the upside, opening the way for bullish correction for the decline measured from 188.78 to 151.65, especially after the price closed the weekly candlestick above 23.6% Fibonacci level of the mentioned decline. Therefore, the bullish trend will be suggested for the upcoming period. supported by the moving average 100, and the next target is located at 165.80, unless breaking 158.70 level and holding with a daily close below it. Expected trading range for today is between 158.70 and 163.00.
Expected trend for today: Bullish

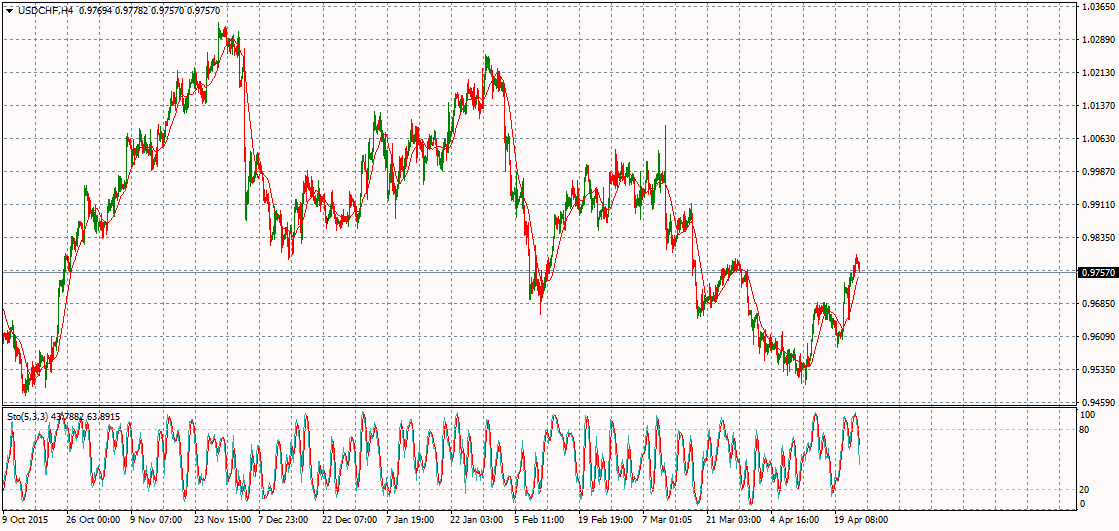
The USD/CHF pair managed to reach the thresholds of the waited positive target at 0.9800 to show some slight bearish bias now affected by stochastic negativity, which might push the price to test the key support 0.9676.
Now we need a clearer confirmation signal for the next trend, which we will get through breaching one of the key levels represented by 0.9676 support and 0.9800 resistance. The contradiction between the EMA50 positivity and stochastic negativity offers another reason for neutrality, noting that breaching the mentioned resistance will lead the price to achieve more gains. Breaking 0.9676 represents the key to return to the medium-term bearish track, which targets testing the previously recorded low at 0.9474 as a next main station.
Expected trading range for today is between 0.9676 support and 0.9850 resistance.
Expected trend for today: Depends on the above mentioned levels

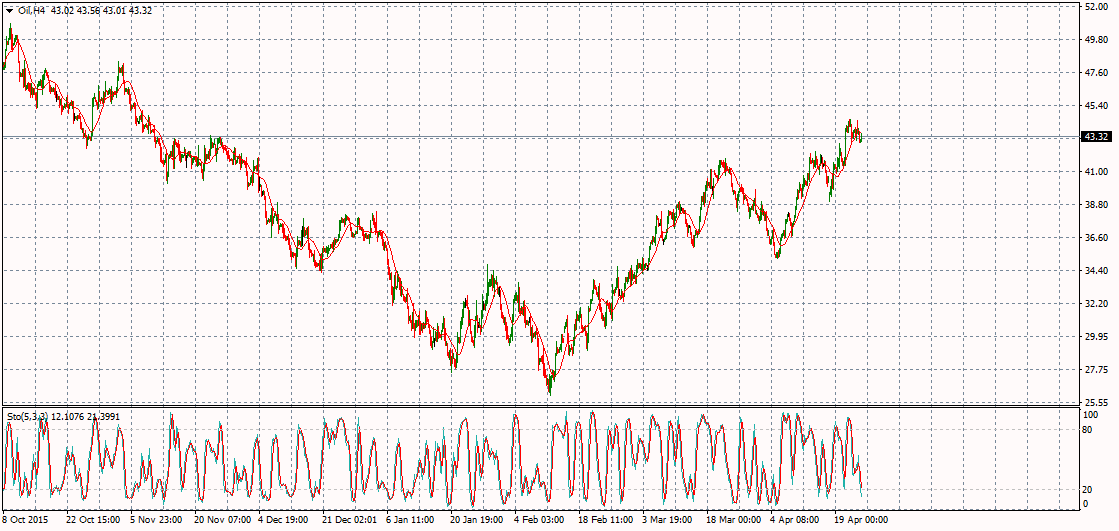
Crude oil price shows sideways trading recently between 43.08 support and 44.47 resistance, and as long as the price is above the mentioned support, we believe that the chances are still valid to resume the bullish trend in the upcoming period. This level represents potential neckline of an intraday bearish pattern, which means that breaking it will push the price to decline towards 42.30 and might extend to 41.50 before any new attempt to rise.
Therefore, we will continue to suggest the bullish trend on the intraday and short-term basis supported by the EMA50, and the price needs to breach 44.00 level to ease the mission of heading towards our next main target at 48.40. Expected trading range for today is between 41.50 support and 45.70 resistance.
Expected trend for today: Bullish


