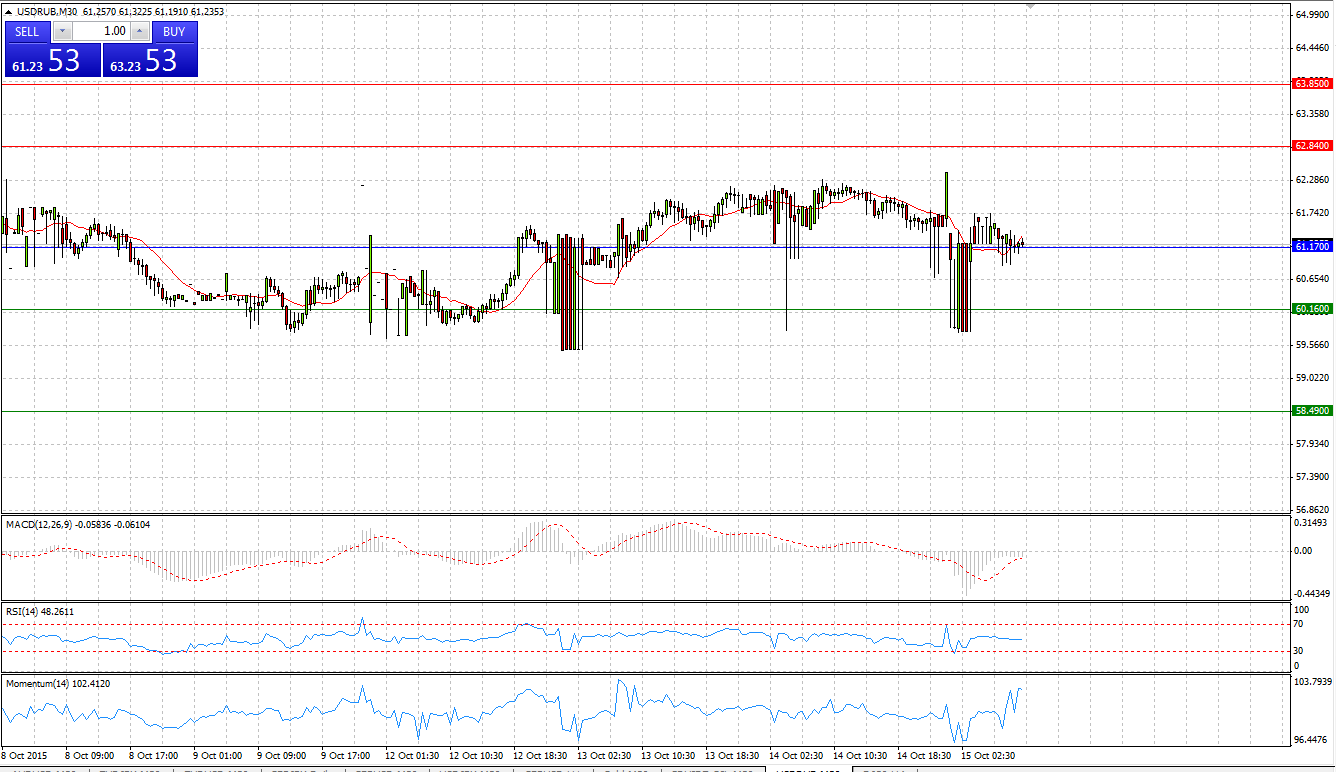
Market Scenario 1: Long positions above 0.7344 with targets at 0.7389 and 0.7462
Market Scenario 2: Short positions below 0.7344 with targets at 0.7271 and 0.7226
Comment: Strengthening of gold had positive affect on AUD/USD. Aussie during yesterday's session managed to take back half of the losses incurred on Tuesday against US dollar. Today AUD/USD continues raising and moving towards its highest level achieved on Monday at 0.7382. Succeeded to break through this level will open the way to R3.
Supports and Resistances:
R3 0.7462
R2 0.7389
R1 0.7344
PP 0.7271
S1 0.7226
S2 0.7153
S3 0.7108
EUR/JPY
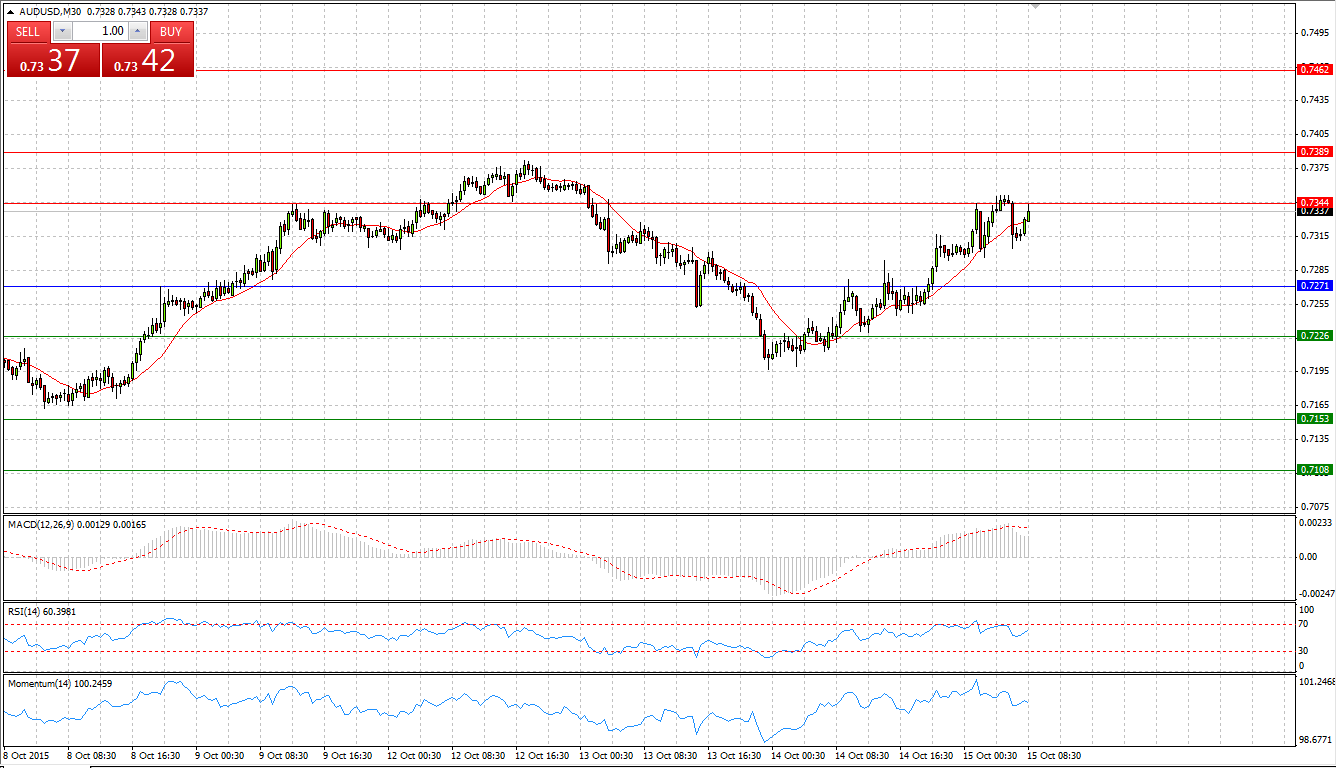
Market Scenario 1: Long positions above 136.10 with targets at 136.36 and 136.57
Market Scenario 2: Short positions below 136.57 with targets at 136.36 and 136.10
Comment: European currency continues trading flat against Japanese yen for the fifth day in the row. EUR/JPY is trading in a range between R2 and S1. Range –Bound strategy can be applied.
Supports and Resistances:
R3 137.04
R2 136.83
R1 136.57
PP 136.36
S1 136.10
S2 135.89
S3 135.63
EUR/USD
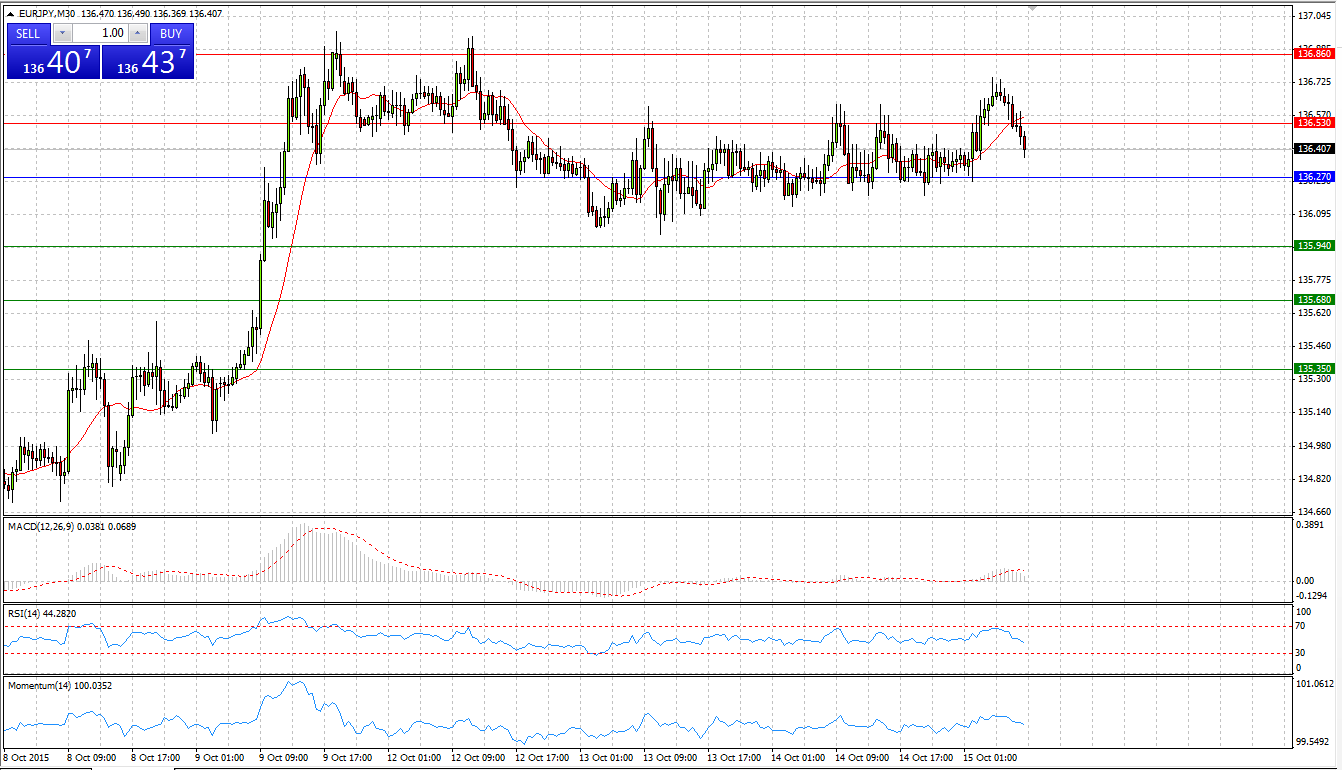
Market Scenario 1: Long positions above 1.1446 with targets at 1.1514 and 1.1557
Market Scenario 2: Short positions below 1.1446 with targets at 1.1403 and 1.1335
Comment: EUR/USD succeeded to break all of its recent highs and trading close to psychologically important level at 1.15, which stands close to the first resistance level. Nonetheless, we have to keep in mind that today is a busy day for US economic releases, including the weekly update on jobless claims. Weak data from US may support EUR for further appreciation against the greenback.
Supports and Resistances:
R3 1.1625
R2 1.1557
R1 1.1514
PP 1.1446
S1 1.1403
S2 1.1335
S3 1.1292
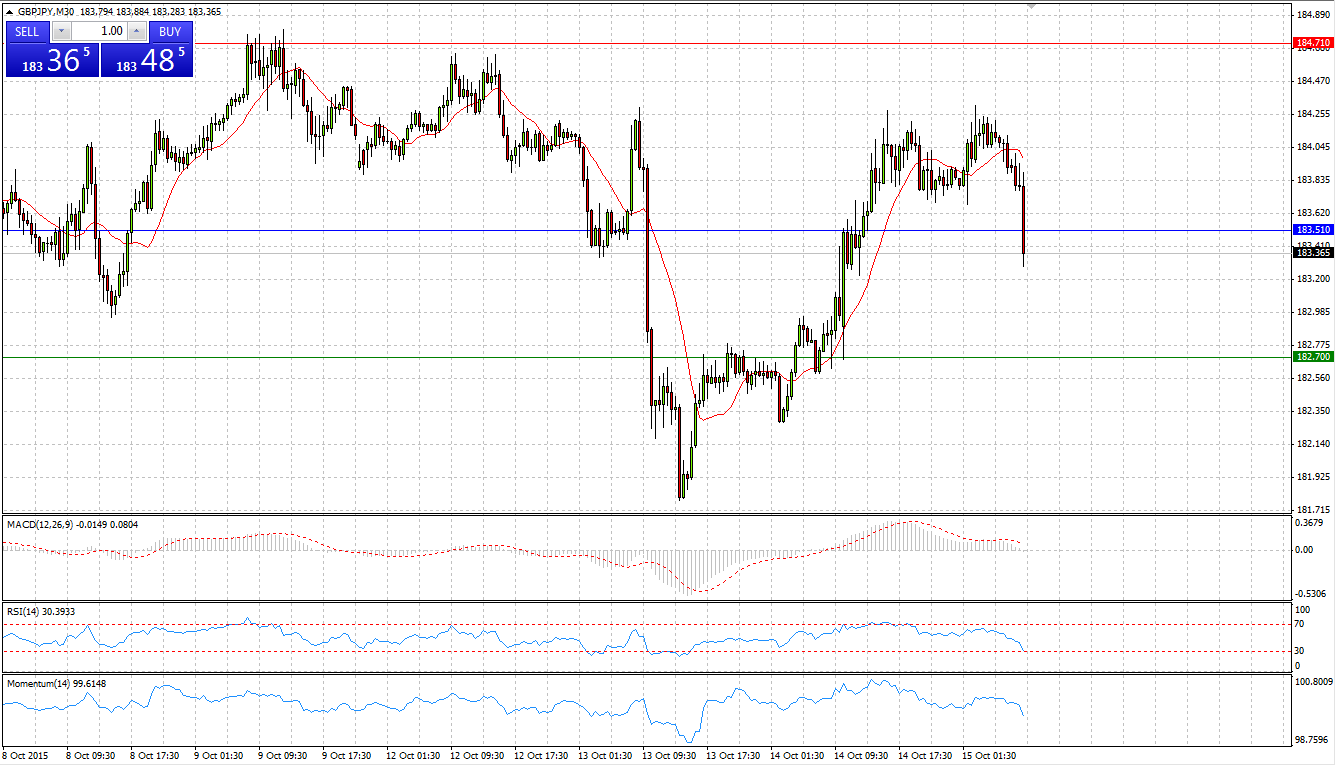
GBP/JPY
Market Scenario 1: Long positions above 183.51 with targets at 184.71 and 186.72
Market Scenario 2: Short positions below 183.51 with targets at 182.70 and 181.50
Comment: The sterling on yesterday’s session managed to take back most of his losses incurred on Tuesday against Japanese yen. Positive economic data continued supporting GBP. U.K. unemployment fell to its lowest rate since mid-2008, reaching 5.4 percent. Pay growth excluding bonuses slowed to 2.8 percent from 2.9 percent. With no inflation, Britons are enjoying the strongest growth in real incomes since before the financial crisis. Currently GBP/JPY trading close to Pivot Point level. Bears are trying to take the control back.
Supports and Resistances:
R3 186.72
R2 185.52
R1 184.71
PP 183.51
S1 182.70
S2 181.50
S3 180.69
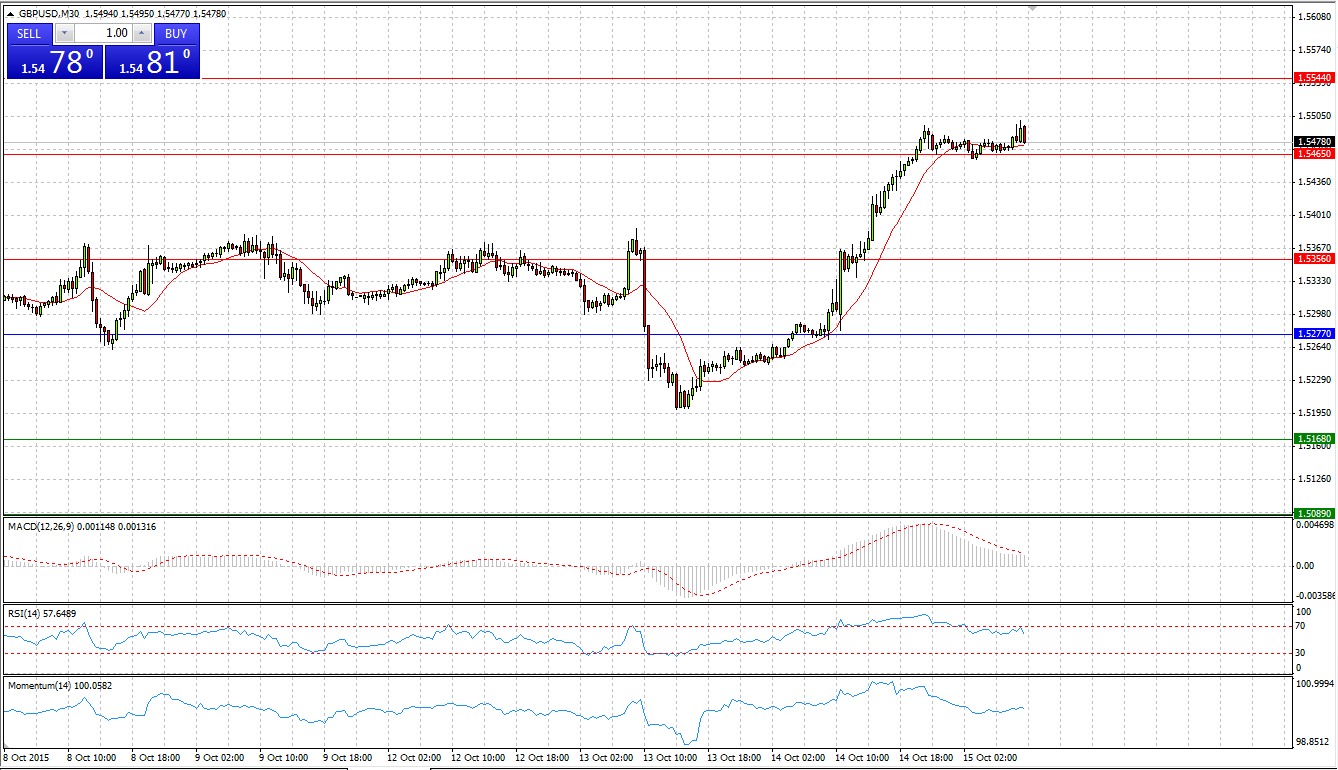
GBP/USD
Market Scenario 1: Long positions above 1.5563 with targets at 1.5651 and 1.5809
Market Scenario 2: Short positions below 1.5563 with targets at 1.5405 and 1.5317
Comment: Bulls managed to regain control during yesterday’s session and GBP/USD had its biggest one-day rally, appreciating more than 230 pips. Sterling continues moving forward against US dollar, supported by positive economic data.
Supports and Resistances:
R3 1.5809
R2 1.5651
R1 1.5563
PP 1.5405
S1 1.5317
S2 1.5159
S3 1.5071
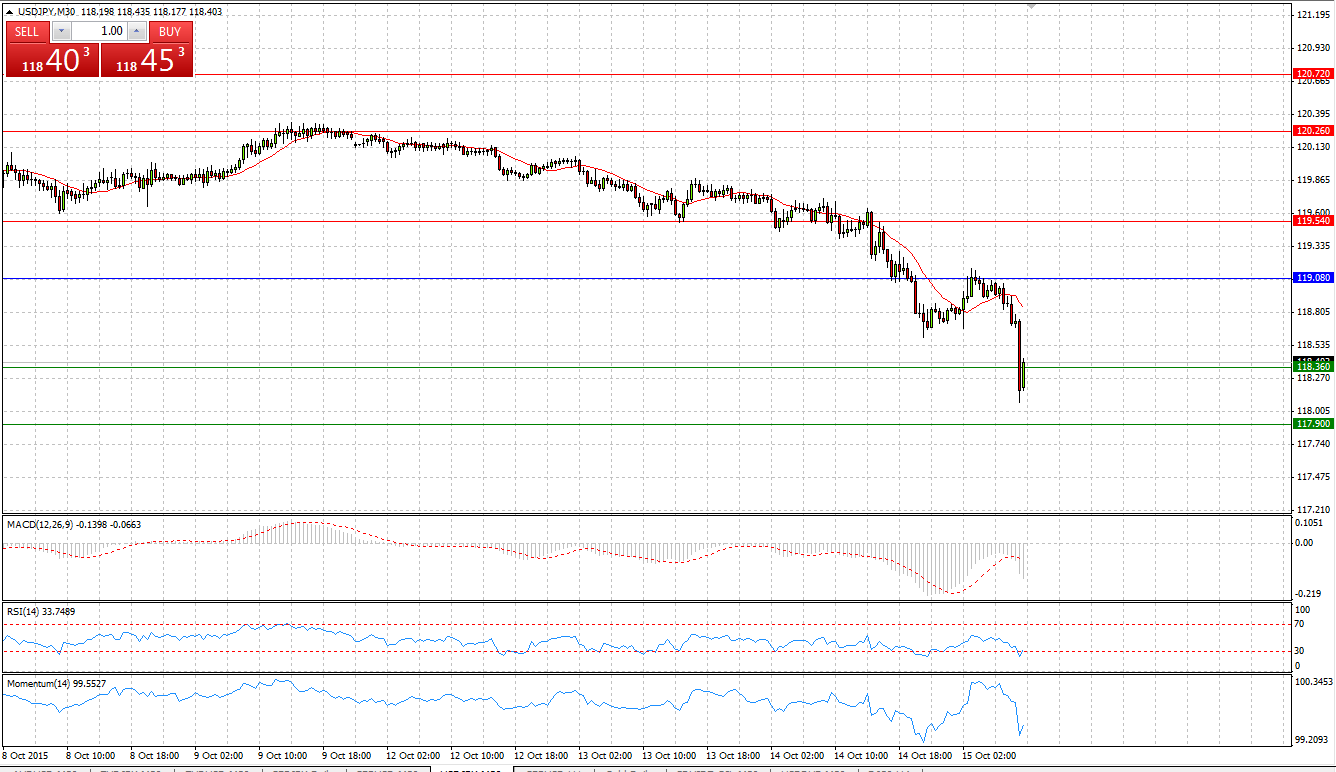
USD/JPY
Market Scenario 1: Long positions above 118.36 with targets at 119.08 and 119.54
Market Scenario 2: Short positions below 118.36 with targets at 117.90 and 117.18
Comment: The prolonged consolidation phase in USD/JPY has ended with a start of the new bearish phase. The currency pair is trading close to the first support level at 118.36. This support should be of certain significance, as it has supported the currency since 9th of February 2015.
Supports and Resistances:
R3 120.72
R2 120.26
R1 119.54
PP 119.08
S1 118.36
S2 117.90
S3 117.18
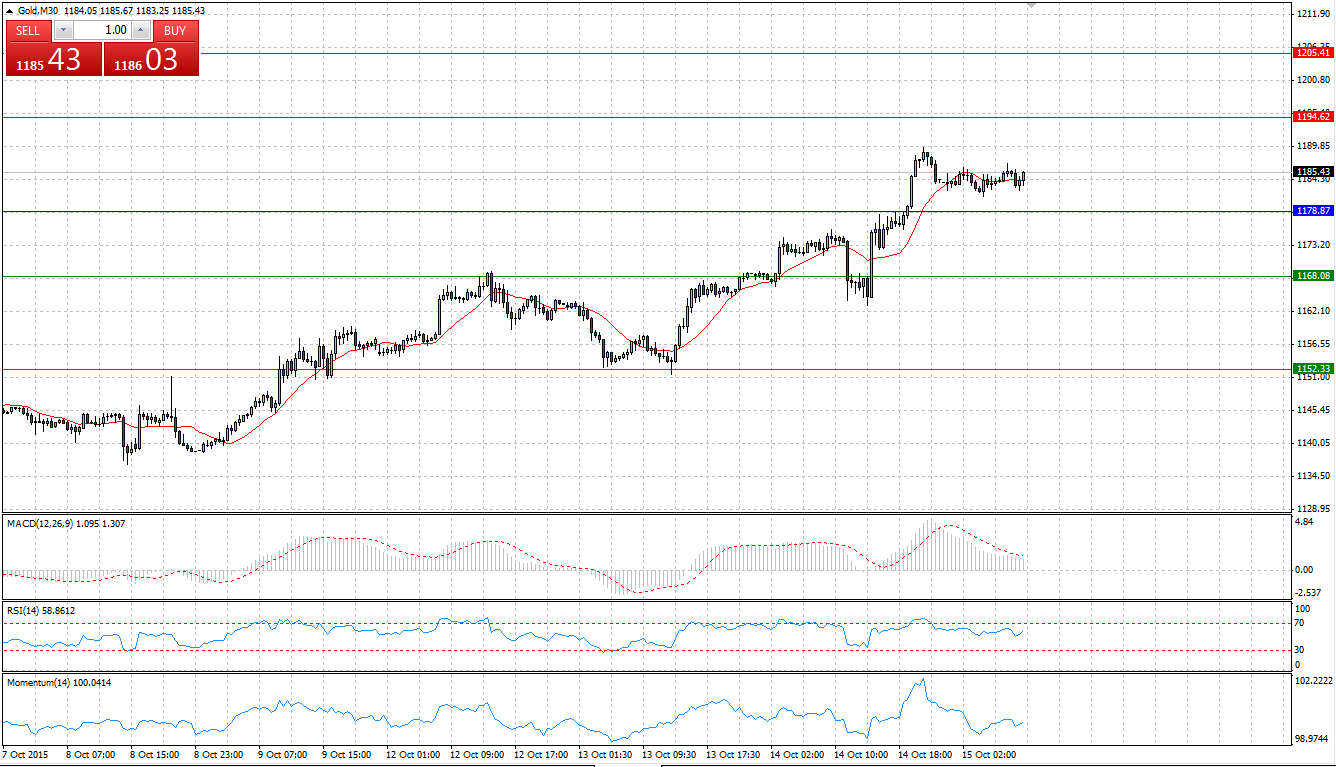
GOLD
Market Scenario 1: Long positions above 1178.87 with targets at 1194.62 and 1205.41
Market Scenario 2: Short positions below 1178.87 with targets at 1168.08 and 1152.33
Comment: Gold continues strengthening against US dollar for the fourth day in the row. During yesterday’s session, the bullion broke through 24th of August high and reached $1189.65, its highest level since 22nd of June. Currently, gold is trading above Pivot Pint level with the aim at R1 and R2.
Supports and Resistances:
R3 1231.95
R2 1205.41
R1 1194.62
PP 1178.87
S1 1168.08
S2 1152.33
S3 1125.79
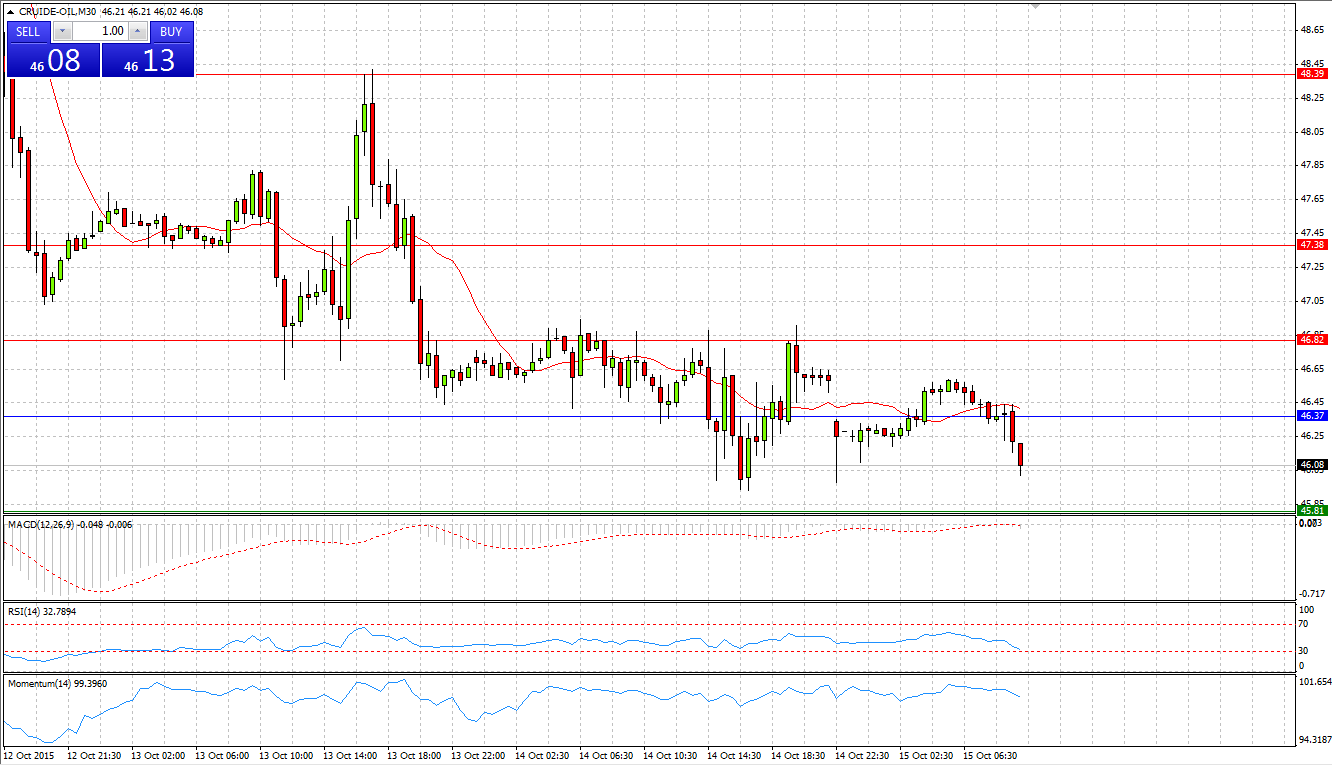
CRUDE OIL
Market Scenario 1: Long positions above 46.37 with targets at 46.82 and 47.38
Market Scenario 2: Short positions below 46.37 with targets at 45.81 and 44.35
Comment: Crude continues trading close to its lows reached yesterday slightly below Pivot Point level.
Supports and Resistances:
R3 48.39
R2 47.38
R1 46.82
PP 46.37
S1 45.81
S2 45.36
S3 44.35
USD/RUB
Market Scenario 1: Long positions above 61.21 with targets at 62.60 and 63.68
Market Scenario 2: Short positions below 61.21 with targets at 60.13 and 58.73
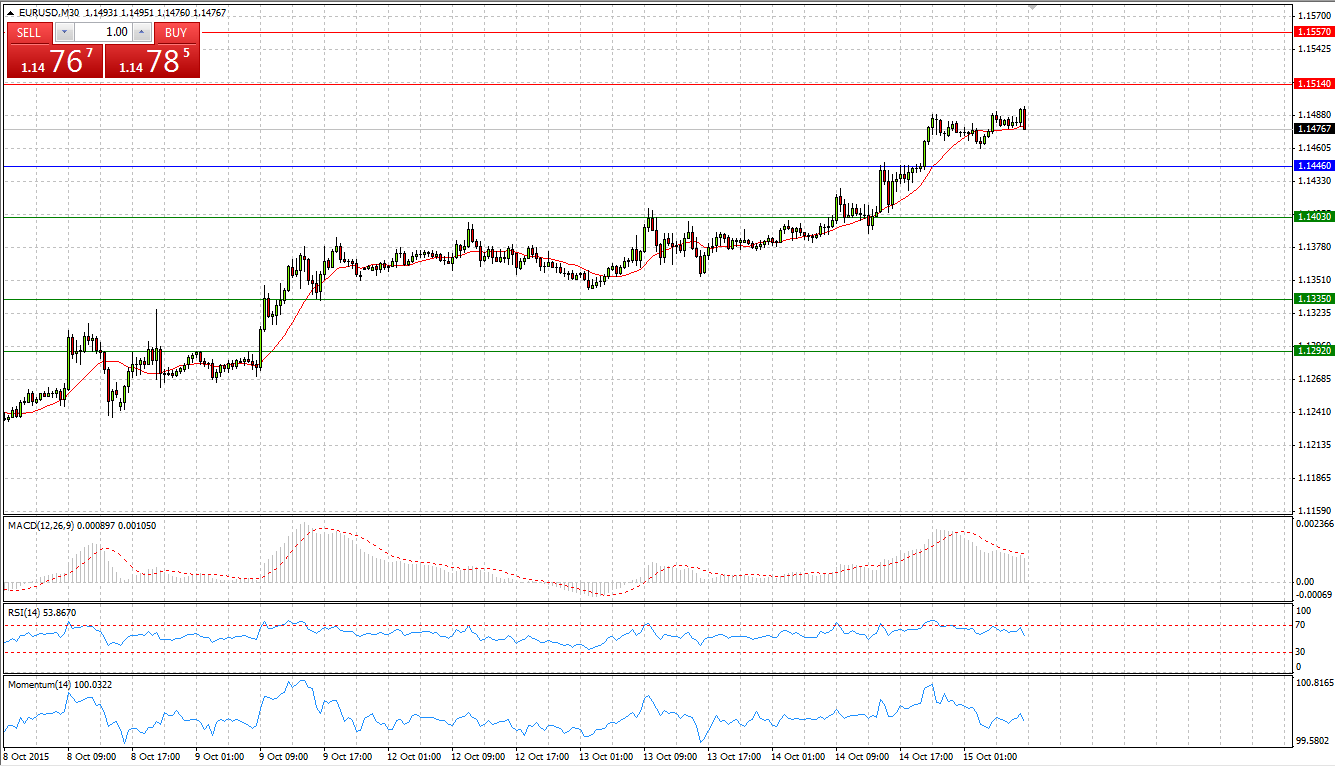
Comment: Ruble found support at the level of 60 rubble per US dollar. The pair is very volatile, trading in a small range for the eighth day in the row. Hardly can we expect appreciation of ruble without increase of crude prices.
Supports and Resistances:
R3 66.16
R2 63.68
R1 62.60
PP 61.21
S1 60.13
S2 58.73
S3 56.26
