*All the charts are 30M charts with daily pivot points.
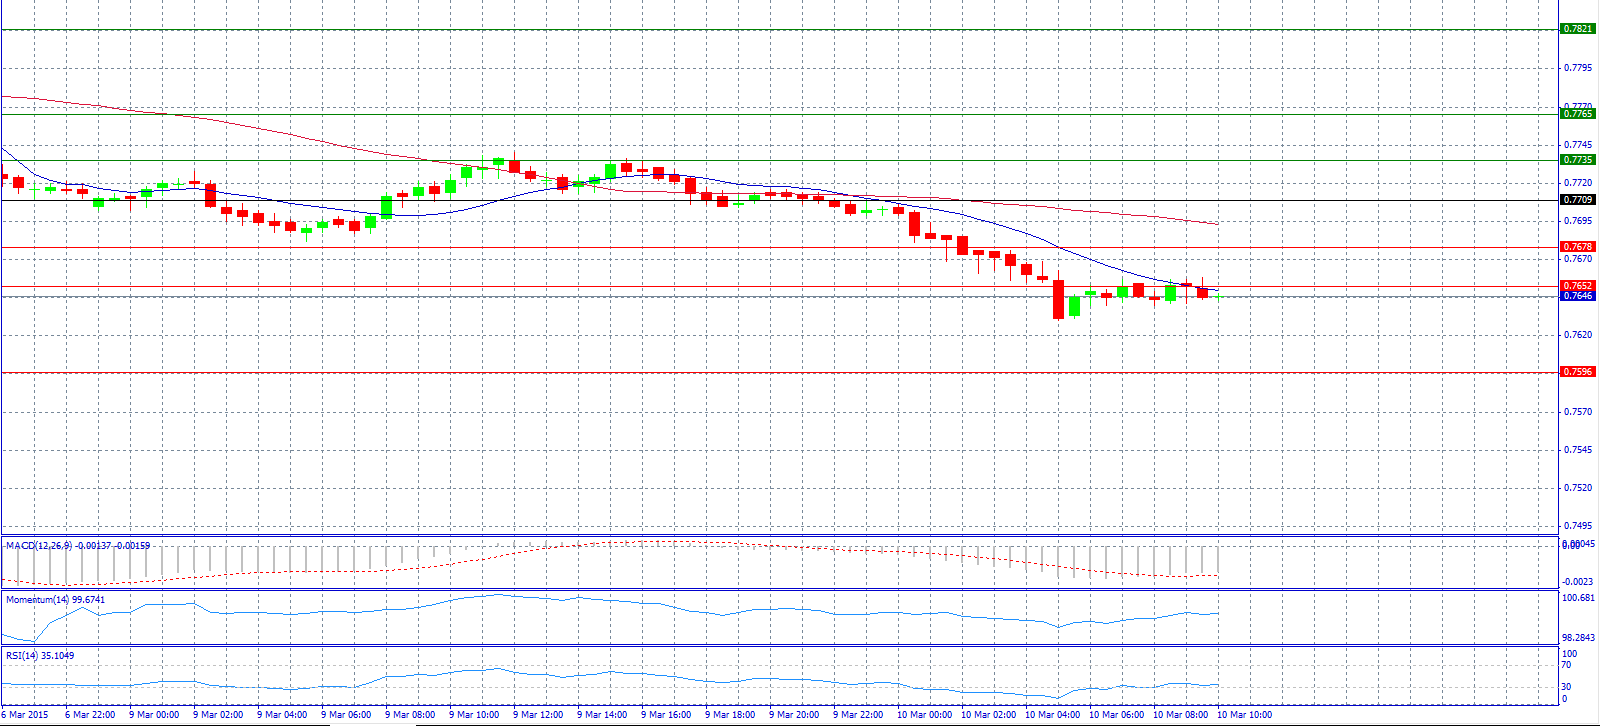
Market Scenario 1: Long positions above 0.7709 with target @ 0.7735.
Market Scenario 2: Short positions below 0.7709 with target @ 0.7596.
Comment: The gold market is not helping the pair which continues to be bearish.
Supports and Resistances:
R3 0.7821
R2 0.7765
R1 0.7735
PP 0.7709
S1 0.7678
S2 0.7652
S3 0.7596
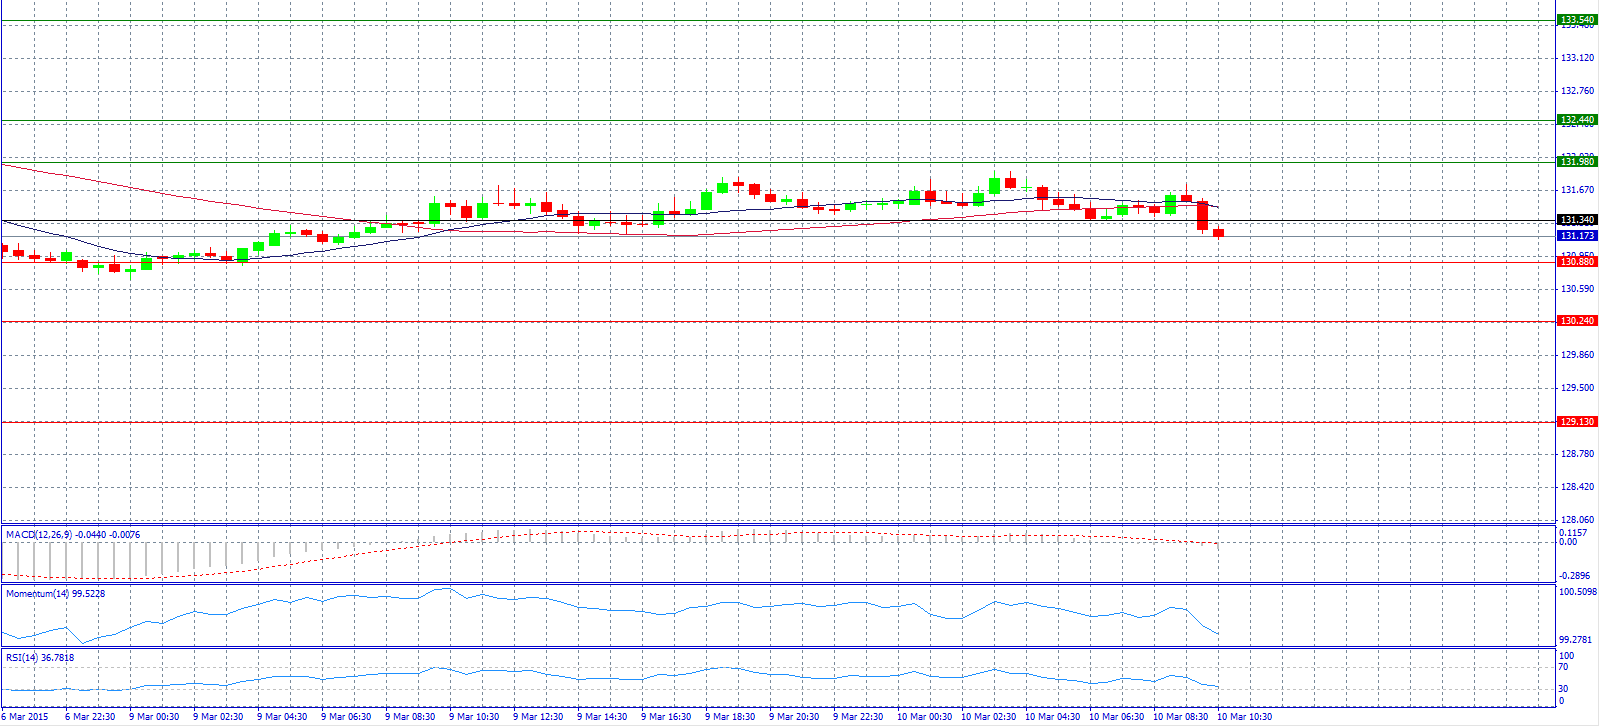
Market Scenario 1: Long positions above 131.34 with target @ 131.98.
Market Scenario 2: Short positions below 131.34 with target @ 130.24.
Comment: The pair is becoming strongly bearish.
Supports and Resistances:
R3 133.54
R2 132.44
R1 131.98
PP 131.34
S1 130.88
S2 130.24
S3 129.13
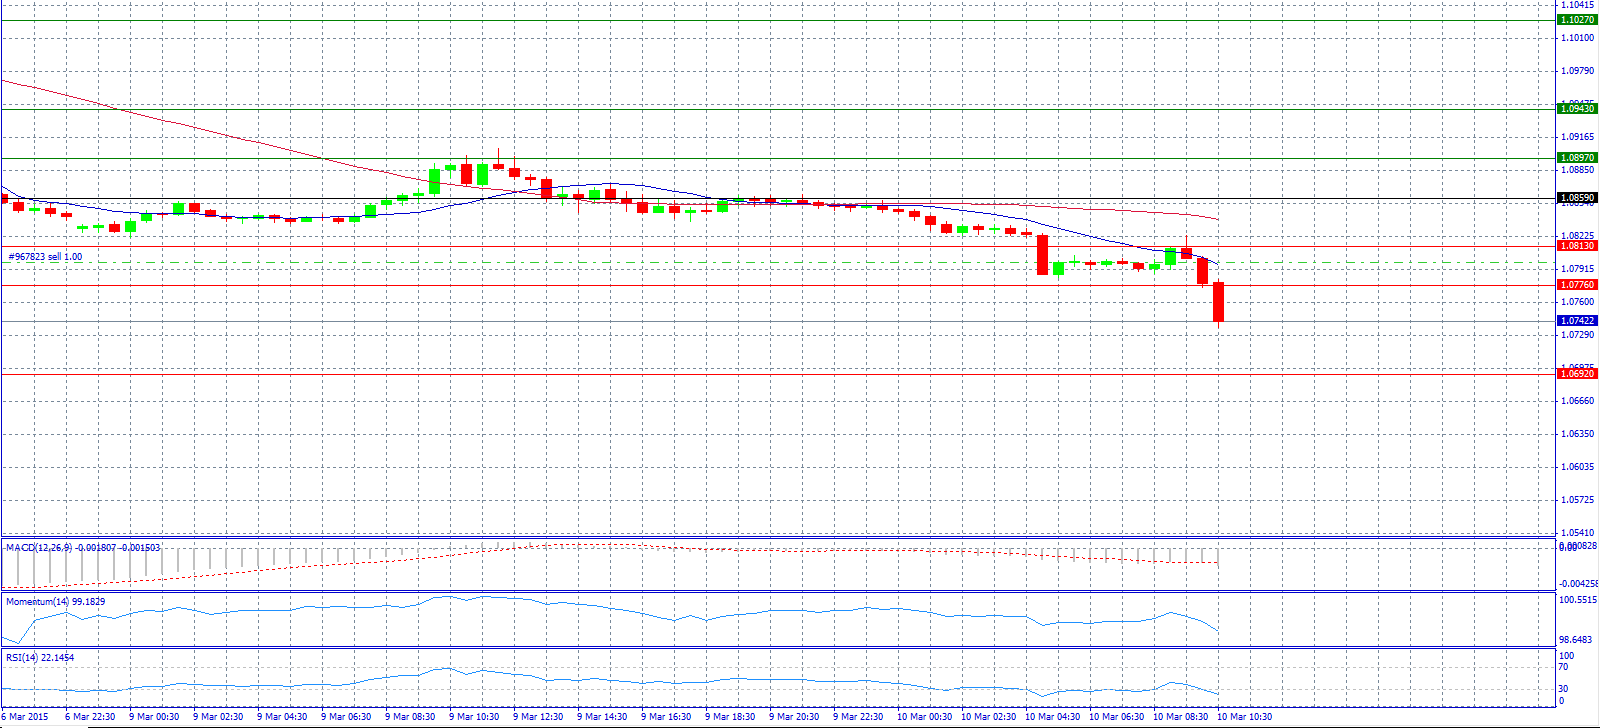
Market Scenario 1: Long positions above 1.0859 with target @ 1.0897.
Market Scenario 2: Short positions below 1.0859 with target @ 1.0692.
Comment: The pair will probably fall to 1.0245 as per Goldman Sachs (NYSE:GS).
Supports and Resistances:
R3 1.1027
R2 1.0943
R1 1.0897
PP 1.0859
S1 1.0813
S2 1.0776
S3 1.0692
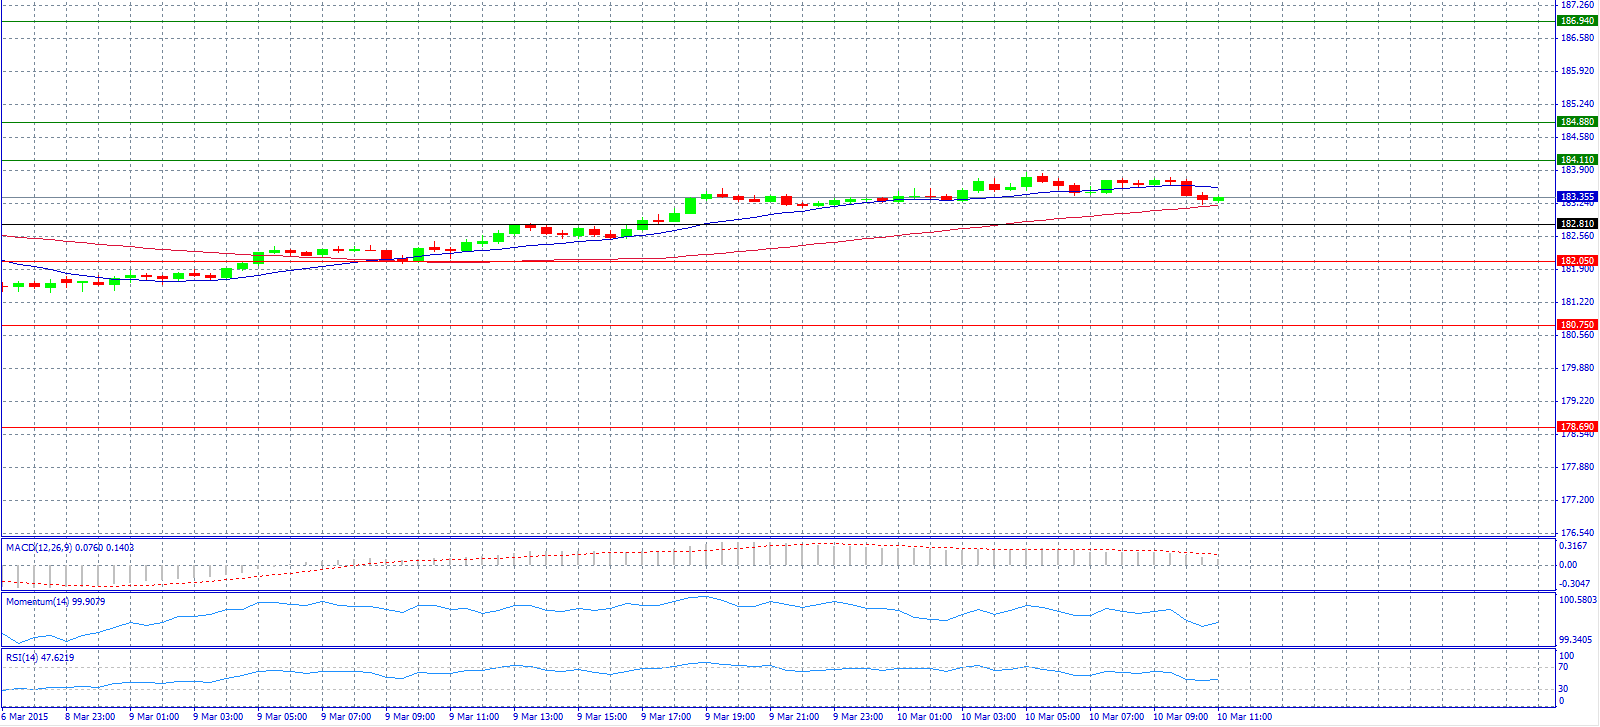
Market Scenario 1: Long positions above 182.81 with target @ 184.11.
Market Scenario 2: Short positions below 182.81 with target @ 182.05.
Comment: The pair rejected 184.00 level.
Supports and Resistances:
R3 186.94
R2 184.88
R1 184.11
PP 182.81
S1 182.05
S2 180.75
S3 178.69
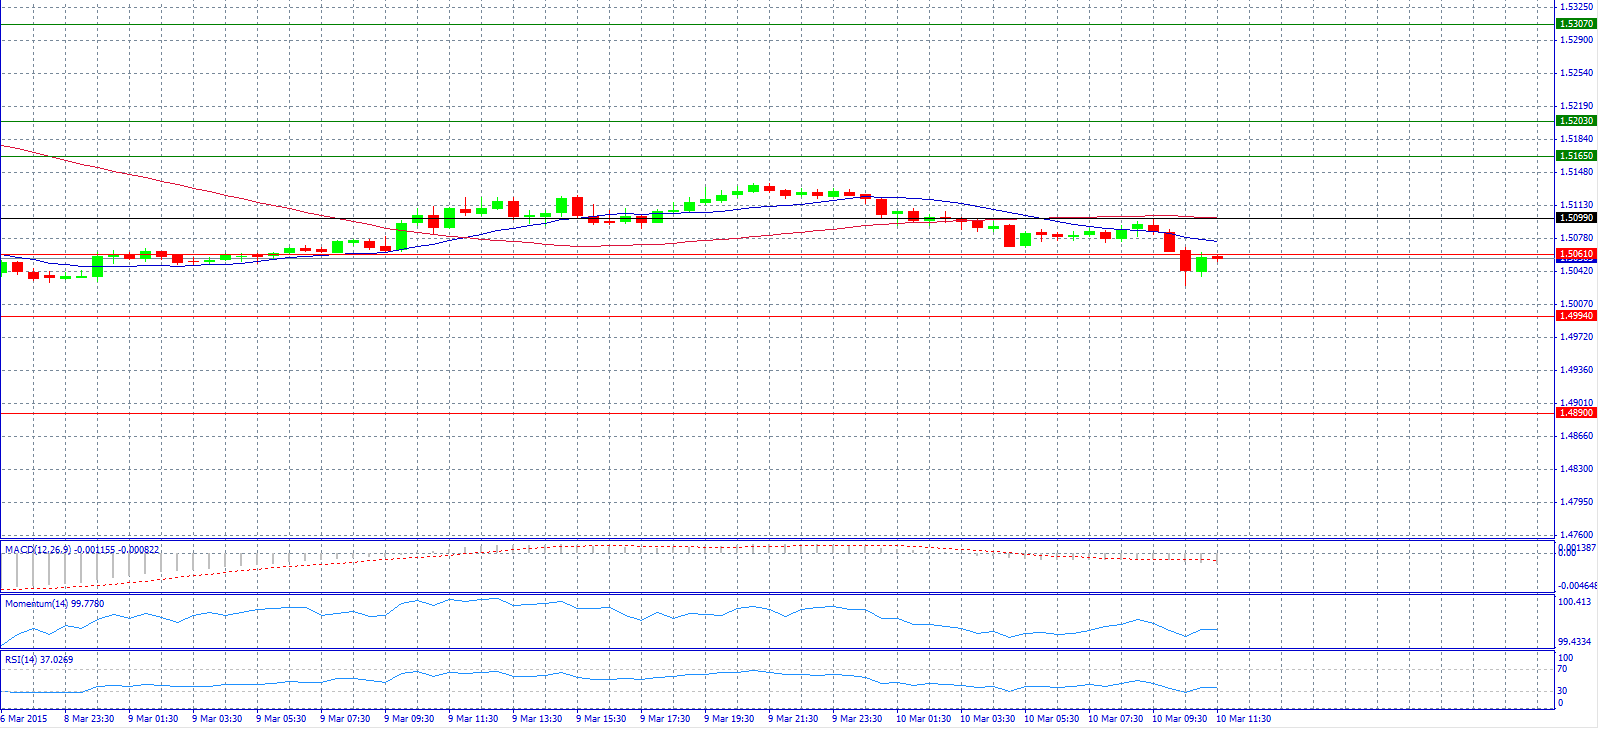
Market Scenario 1: Long positions above 1.5099 with target @ 1.5165.
Market Scenario 2: Short positions below 1.5099 with target @ 1.4994.
Comment: The pair will reach 1.4950 level according to analysts at UOB Group.
Supports and Resistances:
R3 1.5307
R2 1.5203
R1 1.5165
PP 1.5099
S1 1.5061
S2 1.4994
S3 1.4890
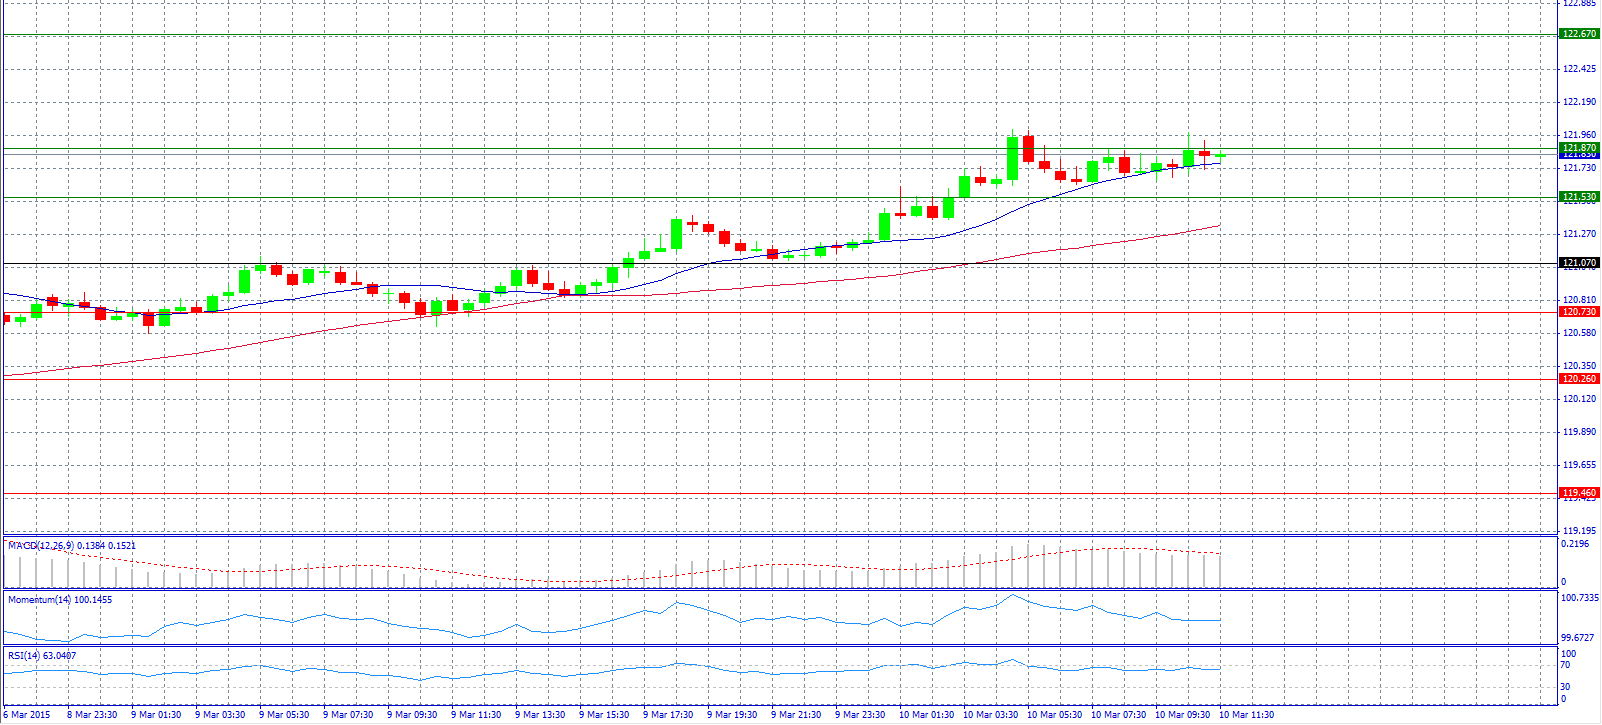
Market Scenario 1: Long positions above 121.07 with target @ 122.67.
Market Scenario 2: Short positions below 121.07 with target @ 120.73.
Comment: The pair was advancing higher during the Asian session, making fresh trend highs at 122.00.
Supports and Resistances:
R3 122.67
R2 121.87
R1 121.53
PP 121.07
S1 120.73
S2 120.26
S3 119.46
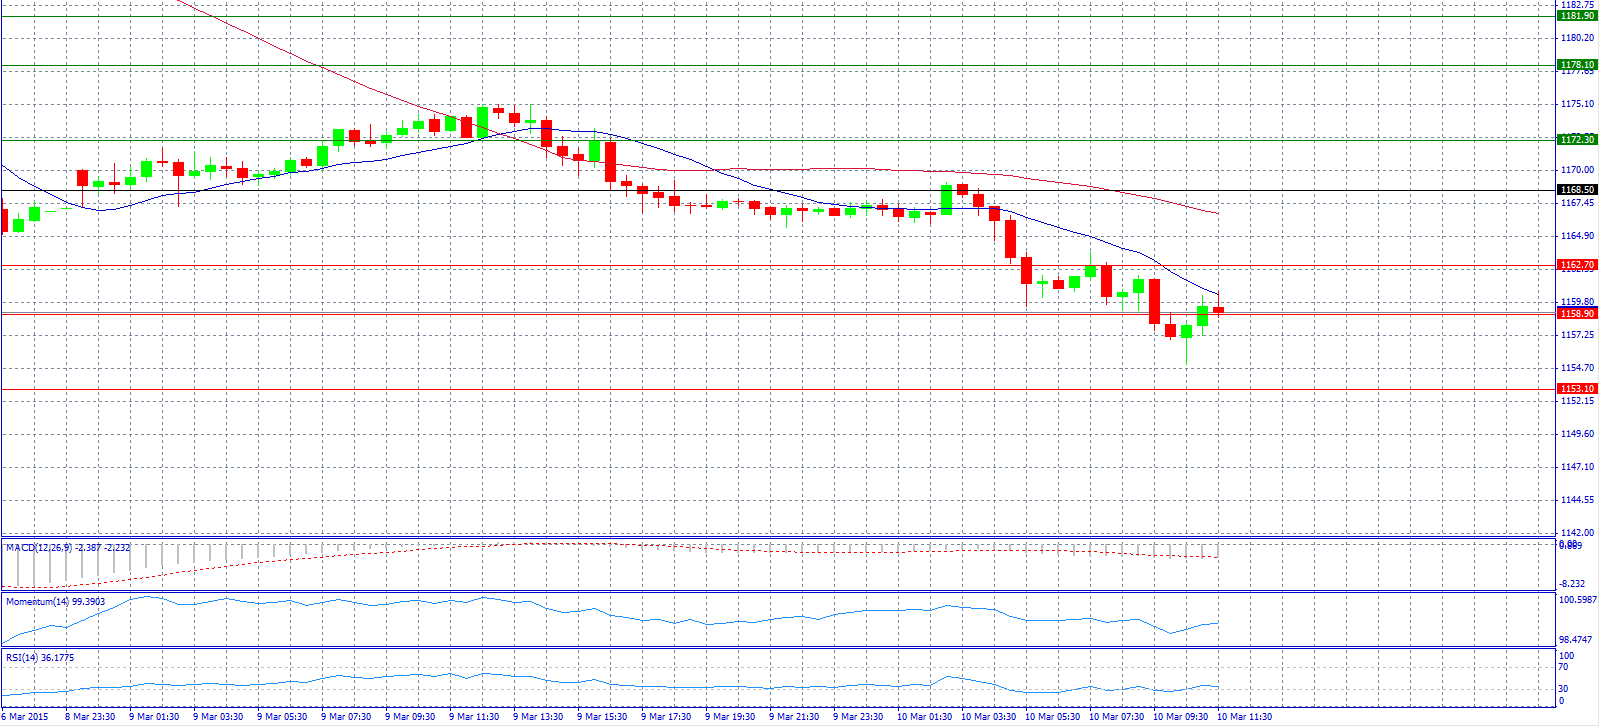
Market Scenario 1: Long positions above 1168.50 with target @ 1172.30.
Market Scenario 2: Short positions below 1168.50 with target @ 1153.10.
Comment: Gold prices fall from 1160.00 level.
Supports and Resistances:
R3 1181.90
R2 1178.10
R1 1172.30
PP 1168.50
S1 1162.70
S2 1158.90
S3 1153.10
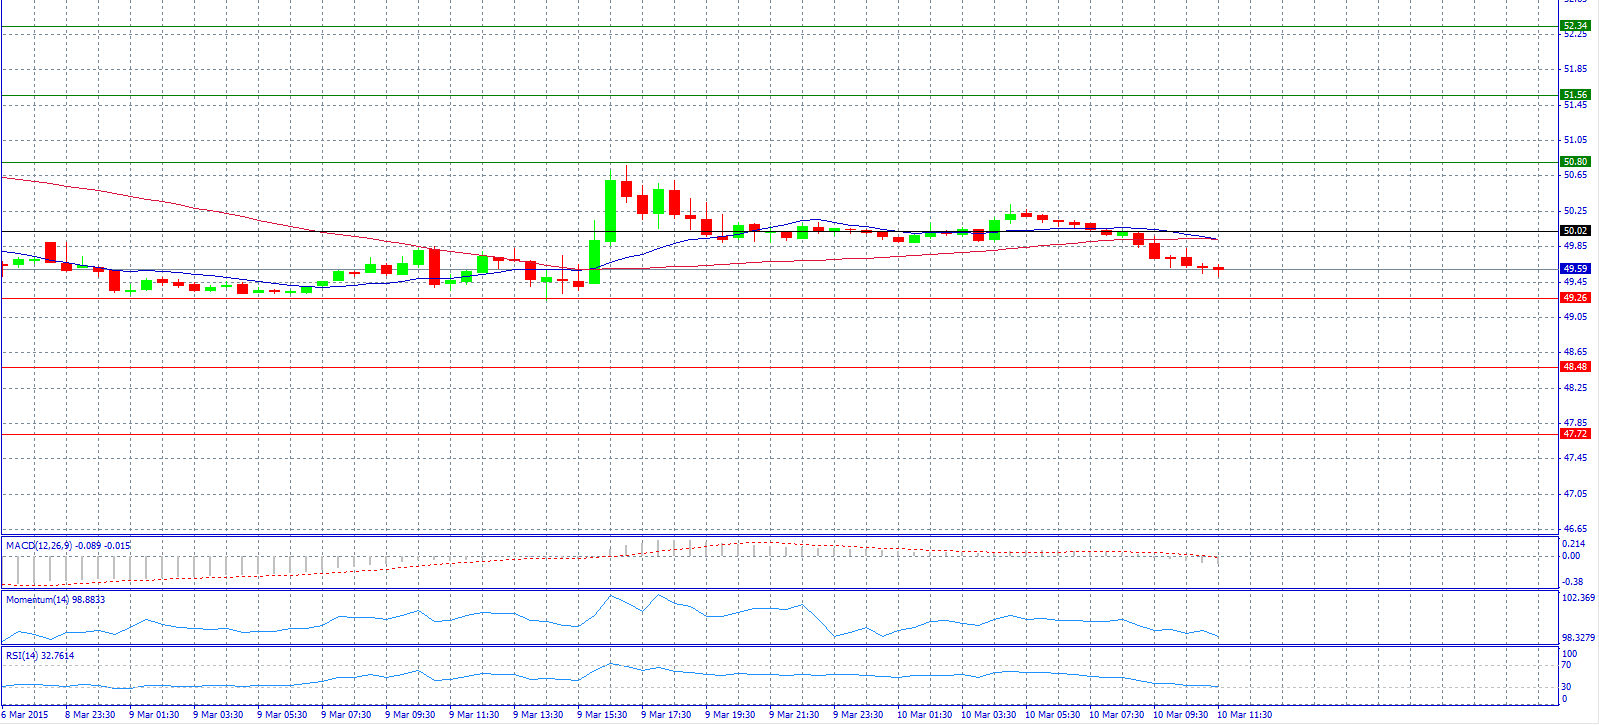
Market Scenario 1: Long positions above 49.96 with target @ 51.04.
Market Scenario 2: Short positions below 49.96 with target @ 48.70.
Comment: Crude oil prices await fresh incentives.
Supports and Resistances:
R3 53.38
R2 52.30
R1 51.04
PP 49.96
S1 48.70
S2 47.62
S3 46.36
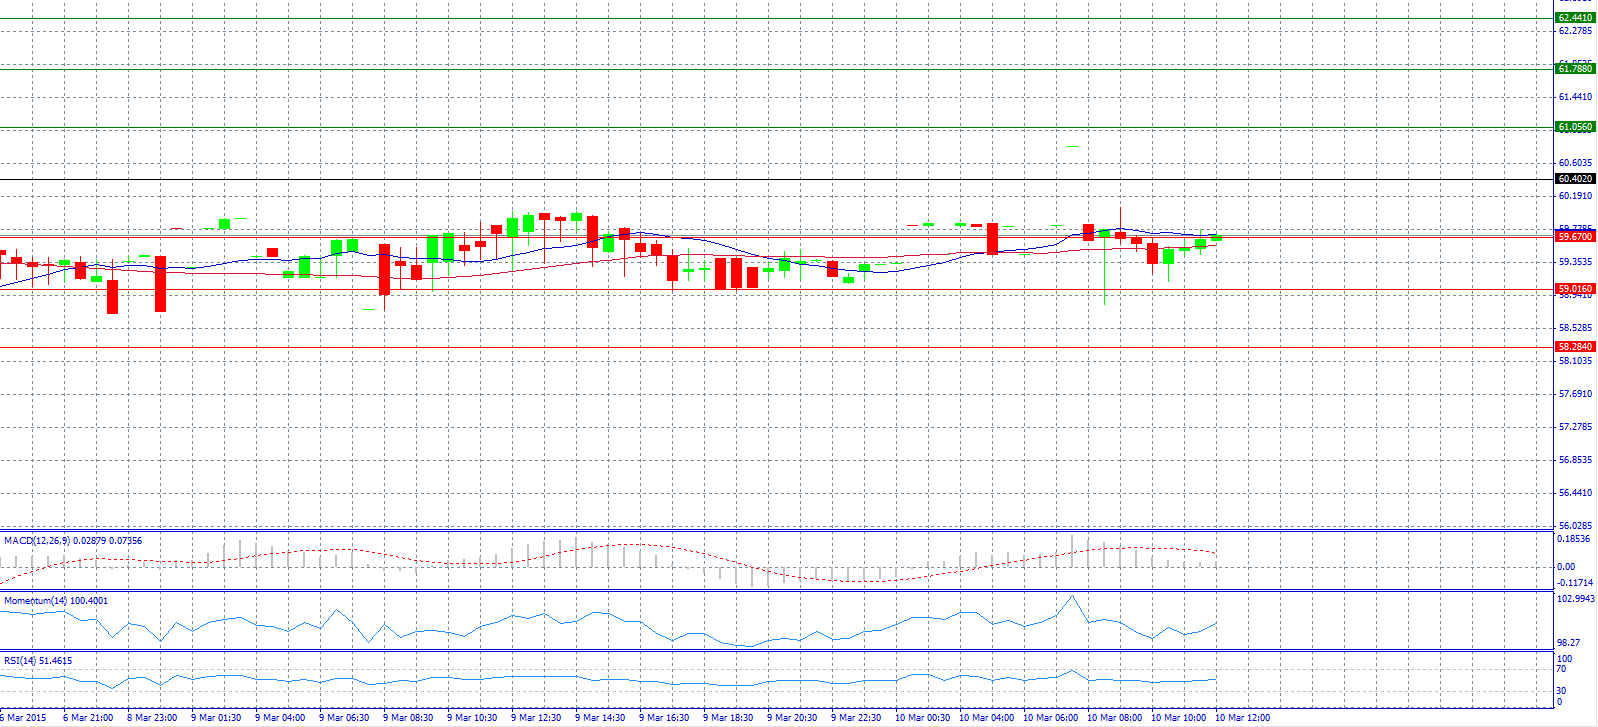
Market Scenario 1: Long positions above 60.402 with target @ 61.056.
Market Scenario 2: Short positions below 60.402 with target @ 59.016.
Comment: Ruble weakened in early trade on Tuesday after a three-day holiday weekend, reacting to the broadly firmer U.S. currency and oil prices slipping to near two-week lows.
Supports and Resistances:
R3 62.441
R2 61.788
R1 61.056
PP 60.402
S1 59.670
S2 59.016
S3 58.284
Forexcorporate Markets Research Department
