*All the charts are 30M with daily pivot points.
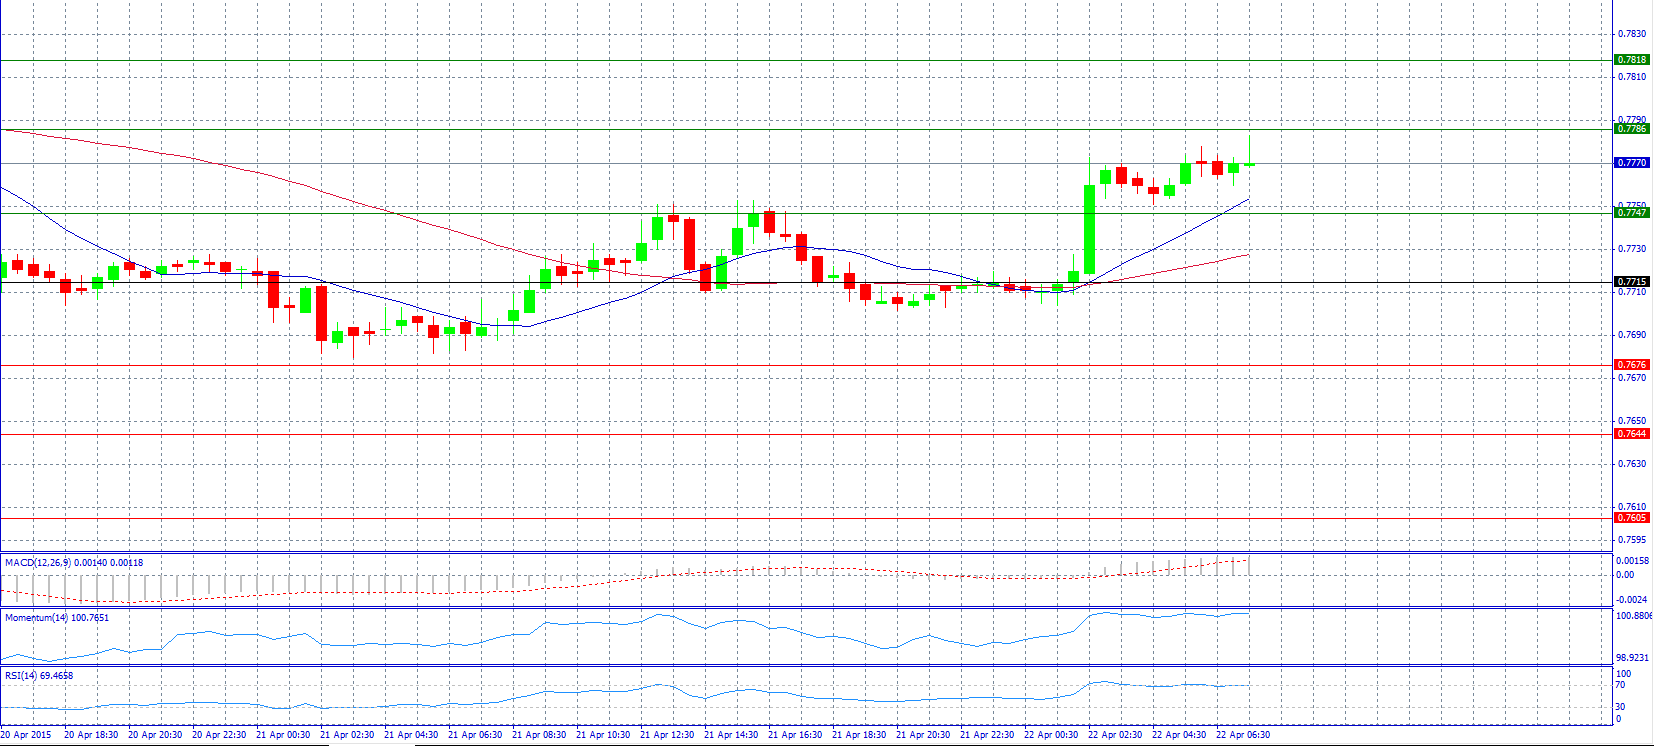
Market Scenario 1: Long positions above 0.7786 with target @ 0.7818.
Market Scenario 2: Short positions below 0.7747 with target @ 0.7715.
Comment: The pair jumped in the early session and hovers around 0.7770 level.
Supports and Resistances:
R3 0.7818
R2 0.7786
R1 0.7747
PP 0.7715
S1 0.7676
S2 0.7644
S3 0.7605
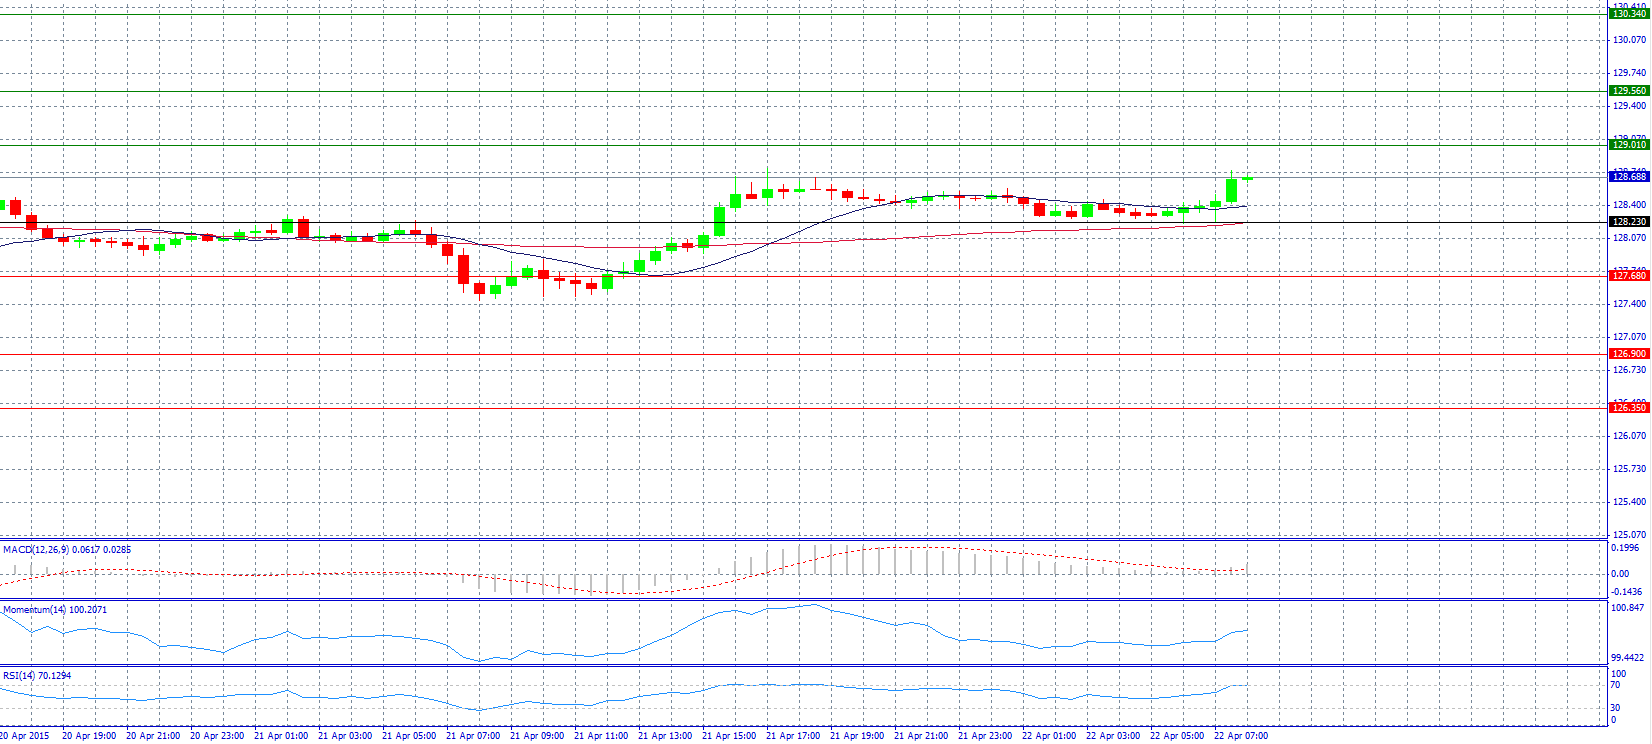
Market Scenario 1: Long positions above 129.01 with target @ 129.56.
Market Scenario 2: Short positions below 128.23 with target @ 127.68.
Comment: The pair trades almost unchanged below 128.70 level.
Supports and Resistances:
R3 130.34
R2 129.56
R1 129.01
PP 128.23
S1 127.68
S2 126.90
S3 126.35
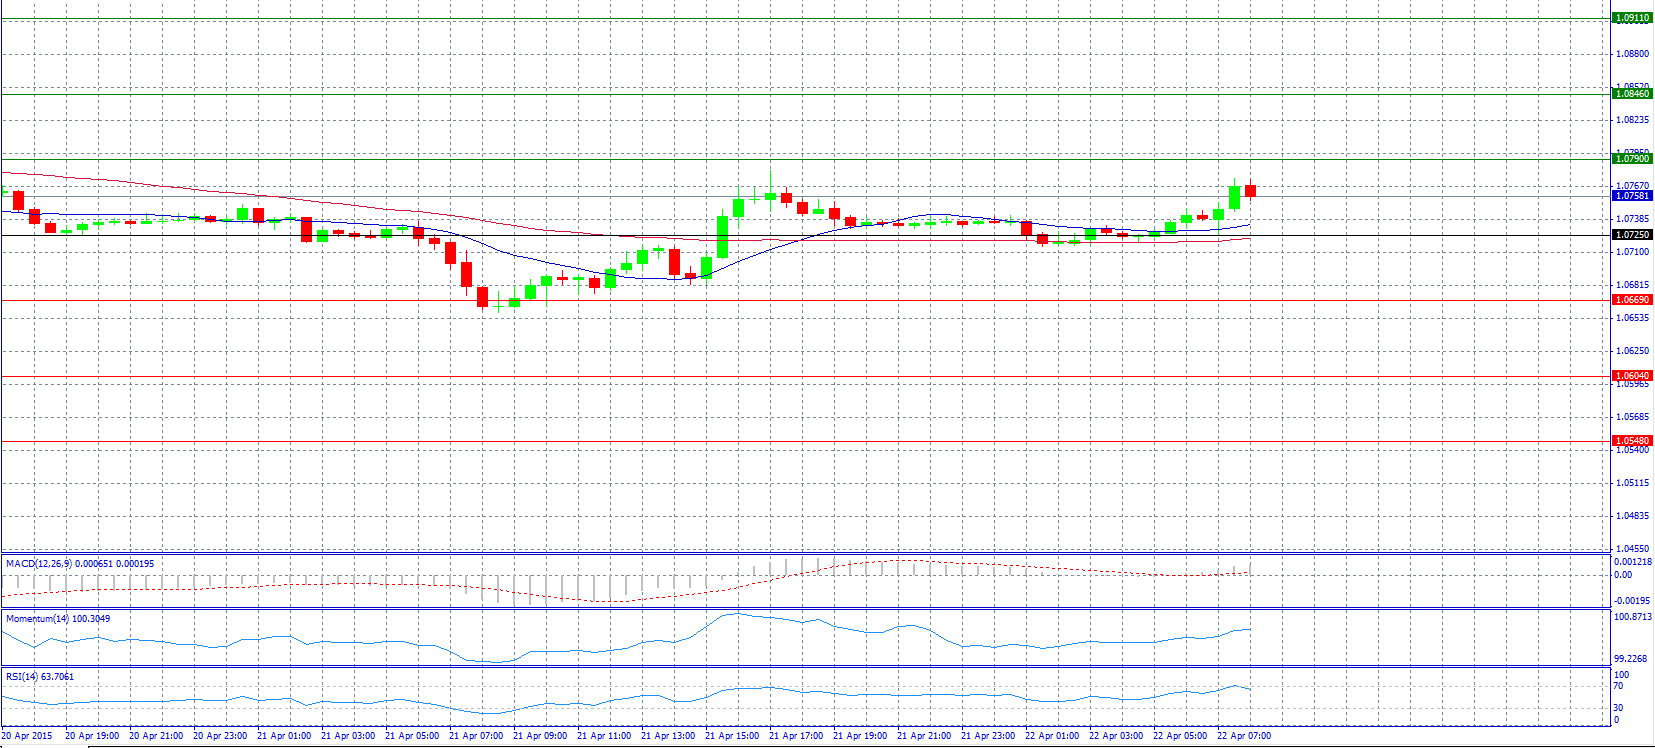
Market Scenario 1: Long positions above 1.0790 with target @ 1.0846.
Market Scenario 2: Short positions below 1.0725 with target @ 1.0669.
Comment: The pair strengthened and advanced above 1.0750 level.
Supports and Resistances:
R3 1.0911
R2 1.0846
R1 1.0790
PP 1.0725
S1 1.0669
S2 1.0604
S3 1.0548
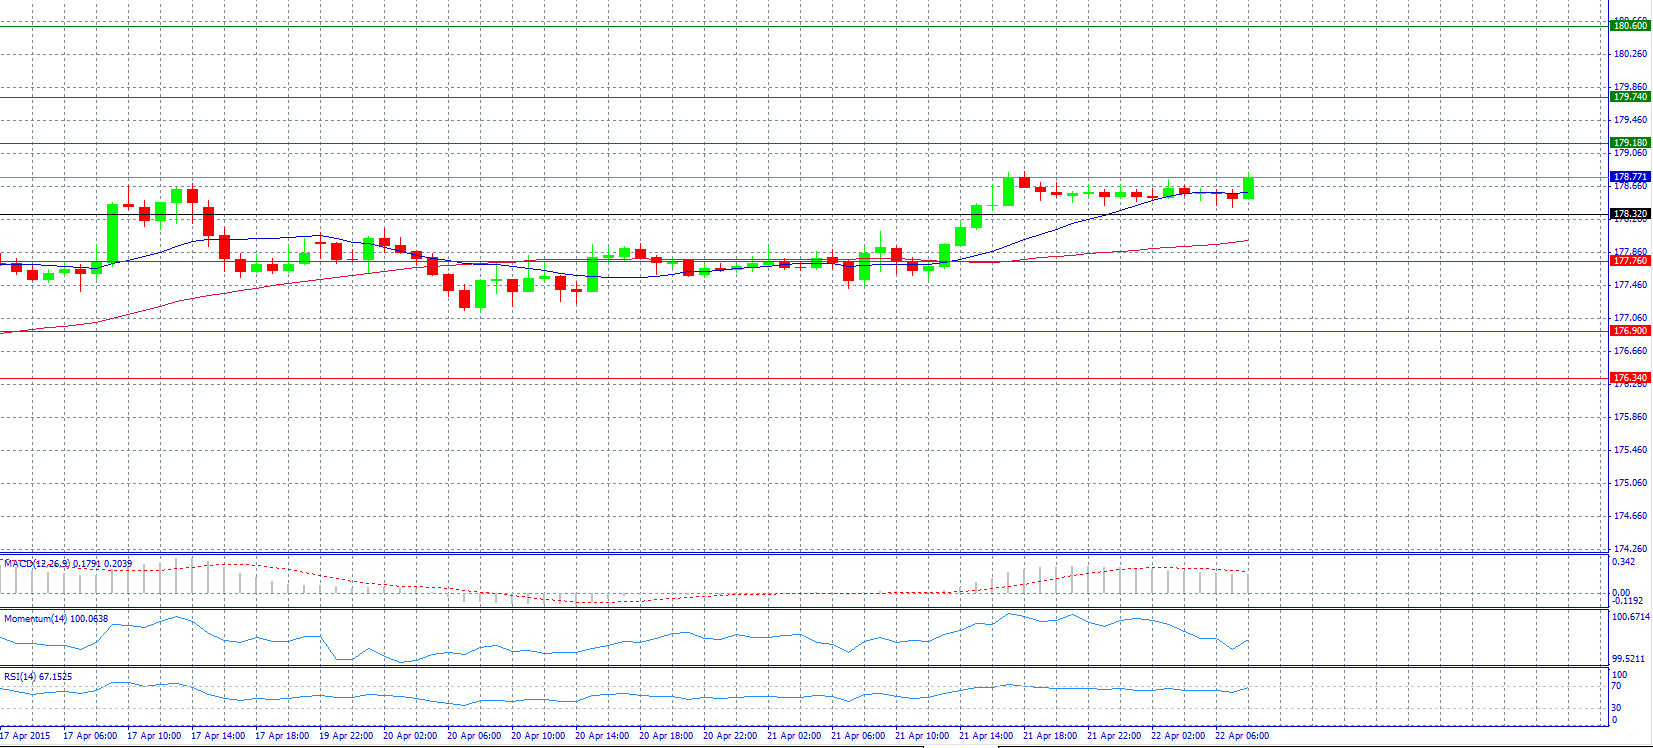
Market Scenario 1: Long positions above 179.18 with target @ 179.74.
Market Scenario 2: Short positions below 178.32 with target @ 177.76.
Comment: The pair trades steady above the support level 178.32.
Supports and Resistances:
R3 180.60
R2 179.74
R1 179.18
PP 178.32
S1 177.76
S2 176.90
S3 176.34
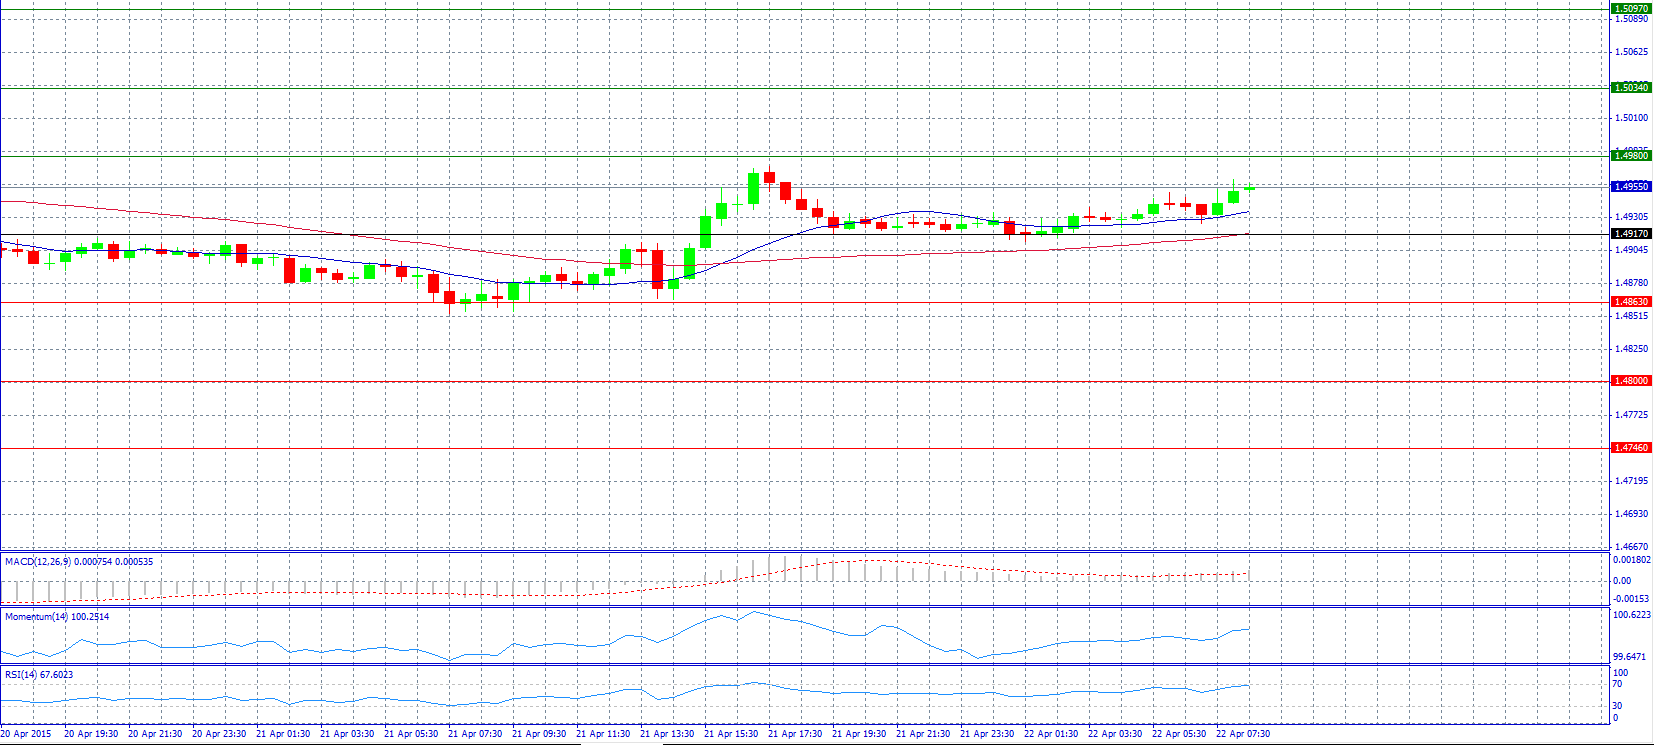
Market Scenario 1: Long positions above 1.4980 with target @ 1.5034.
Market Scenario 2: Short positions below 1.4917 with target @ 1.4863.
Comment: The pair shows some signs of strengthening and trades above 1.4960 level.
Supports and Resistances:
R3 1.5097
R2 1.5034
R1 1.4980
PP 1.4917
S1 1.4863
S2 1.4800
S3 1.4746
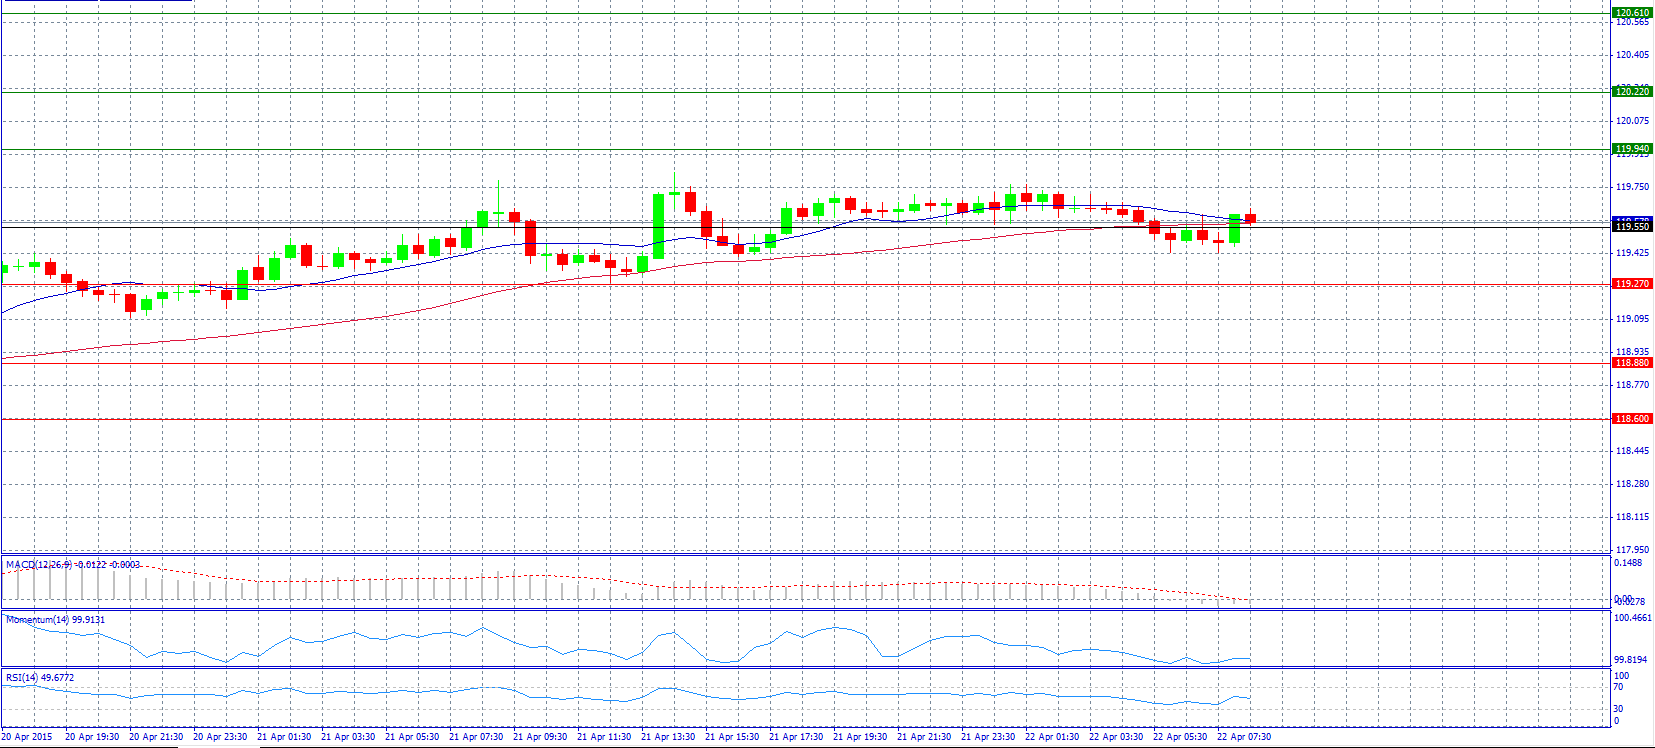
Market Scenario 1: Long positions above 119.55 with target @ 119.94.
Market Scenario 2: Short positions below 119.55 with target @ 119.27.
Comment: The pair trades steady near the support level 119.55.
Supports and Resistances:
R3 120.61
R2 120.22
R1 119.94
PP 119.55
S1 119.27
S2 118.88
S3 118.60
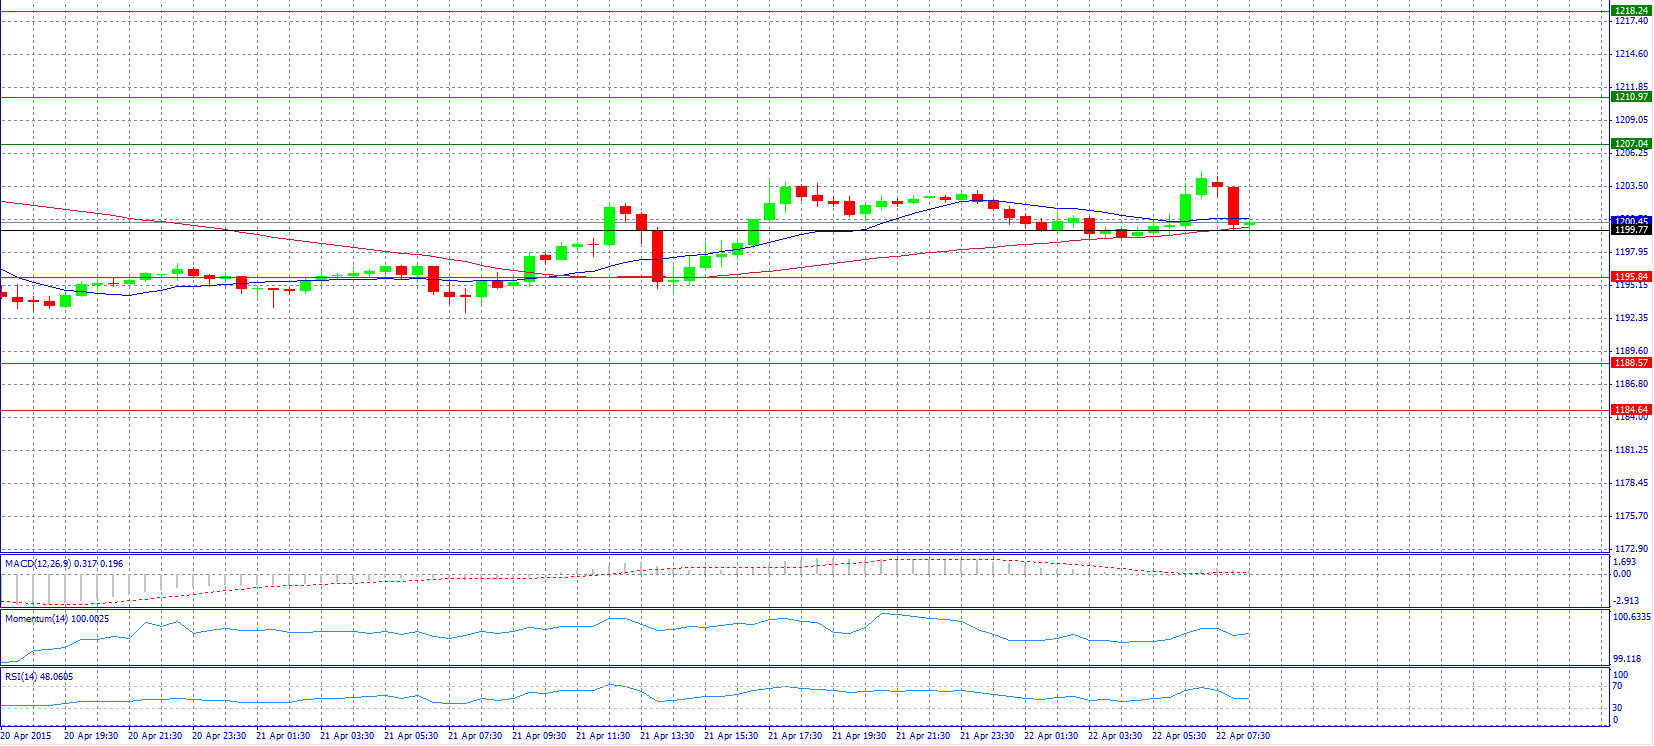
Market Scenario 1: Long positions above 1199.77 with target @ 1207.04.
Market Scenario 2: Short positions below 1199.77 with target @ 1195.84.
Comment: Gold prices dropped and found support at 1199.77 level.
Supports and Resistances:
R3 1218.24
R2 1210.97
R1 1207.04
PP 1199.77
S1 1195.84
S2 1188.57
S3 1184.64
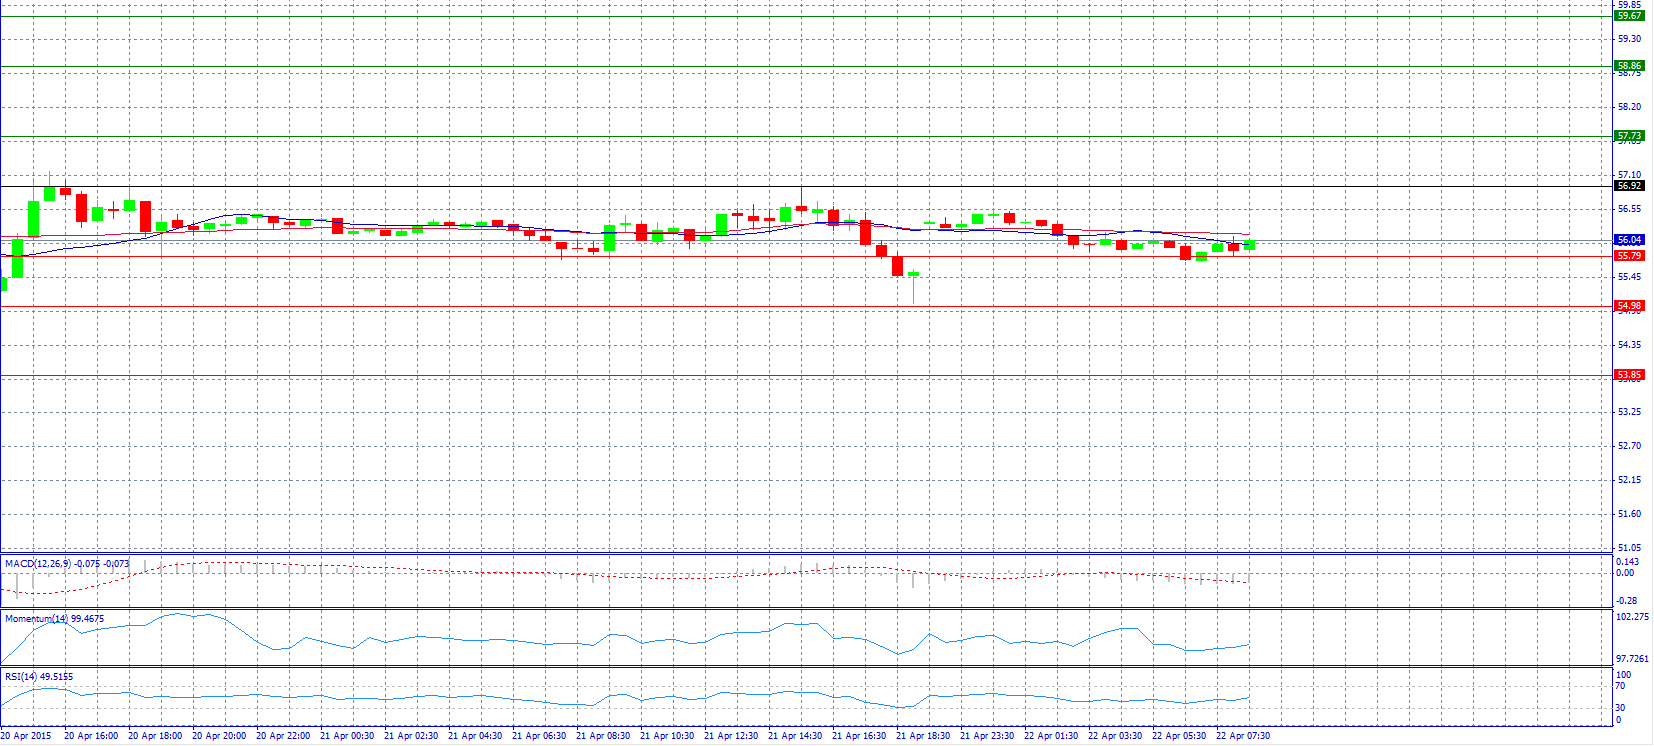
Market Scenario 1: Long positions above 56.92 with target @ 57.73.
Market Scenario 2: Short positions below 55.79 with target @ 54.98.
Comment: Crude oil prices trade steady near 56.00 level.
Supports and Resistances:
R3 59.67
R2 58.86
R1 57.73
PP 56.92
S1 55.79
S2 54.98
S3 53.85
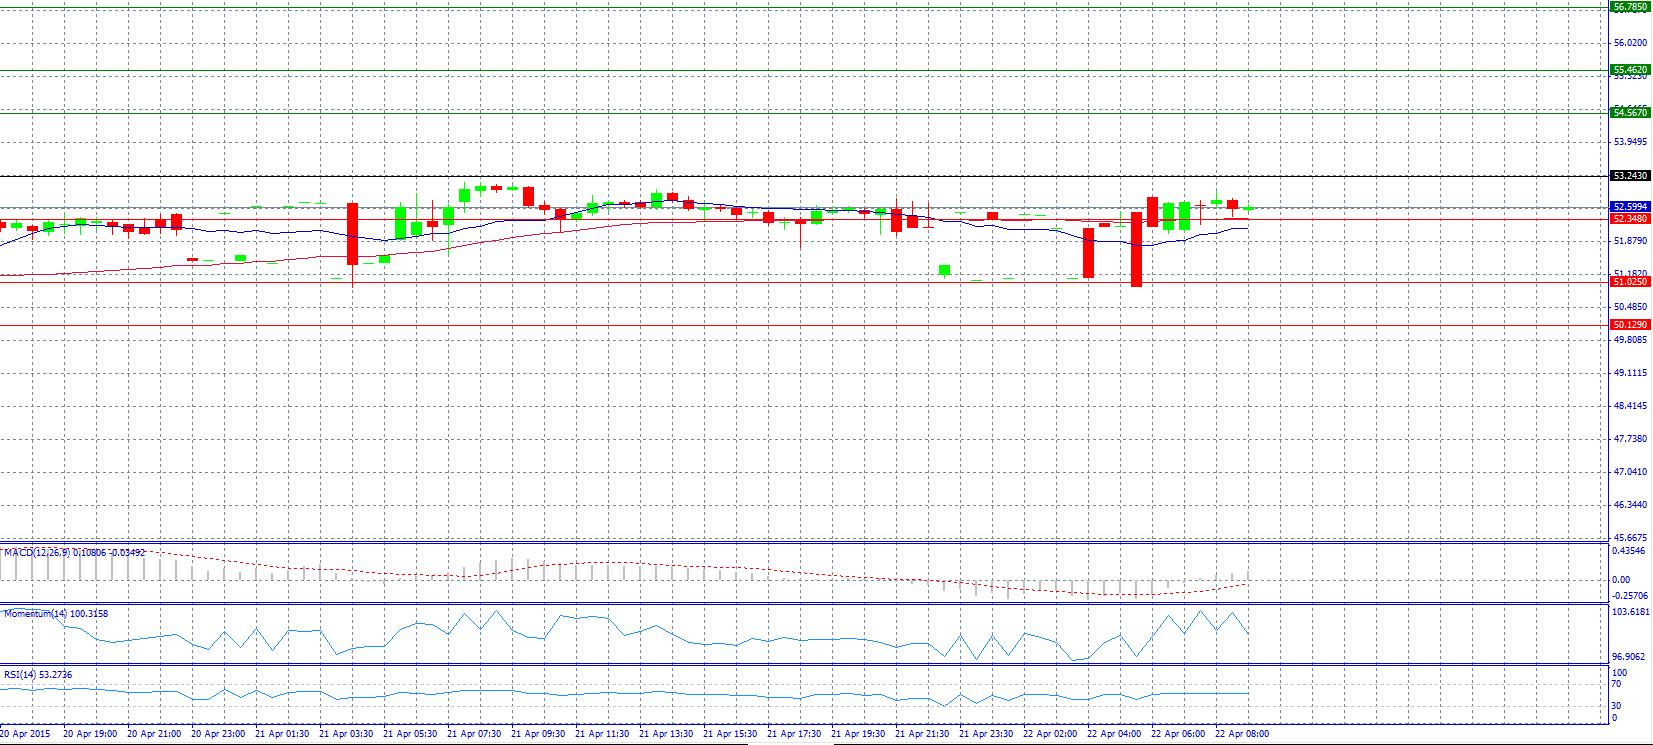
Market Scenario 1: Long positions above 53.243 with target @ 54.567.
Market Scenario 2: Short positions below 52.348 with target @ 51.025.
Comment: The pair surpassed 52.500 level and trades steady.
Supports and Resistances:
R3 56.785
R2 55.462
R1 54.567
PP 53.243
S1 52.348
S2 51.025
S3 50.129
