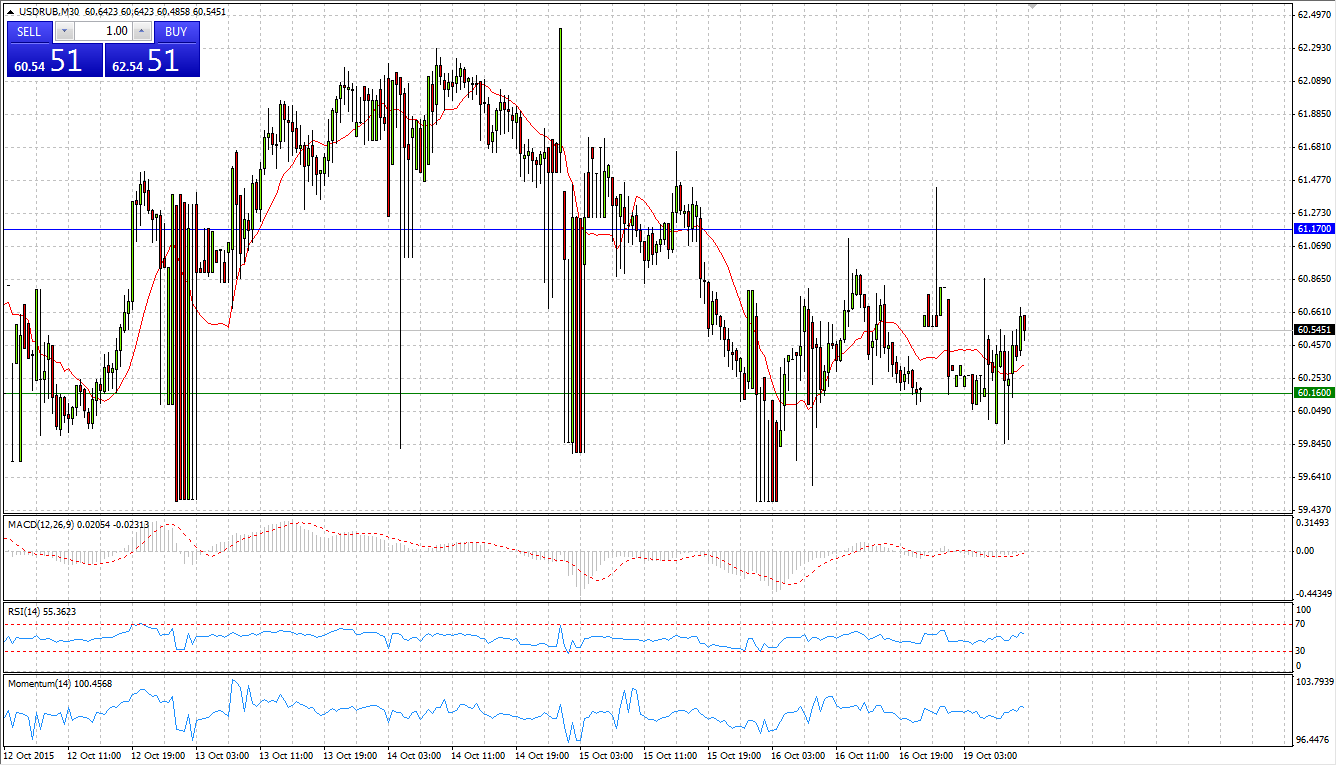
Market Scenario 1: Long positions above 0.7283 with targets at 0.7319 and 0.7371
Market Scenario 2: Short positions below 0.7283 with targets at 0.7231 and 0.7195
Comment: After the selling pressure on Friday’s session, AUD/USD ended the day in a negative territory. At the time being, Aussie is trading below Pivot level, struggling to climb back again.
Supports and Resistances:
R3 0.7407
R2 0.7371
R1 0.7319
PP 0.7283
S1 0.7231
S2 0.7195
S3 0.7143
EUR/JPY
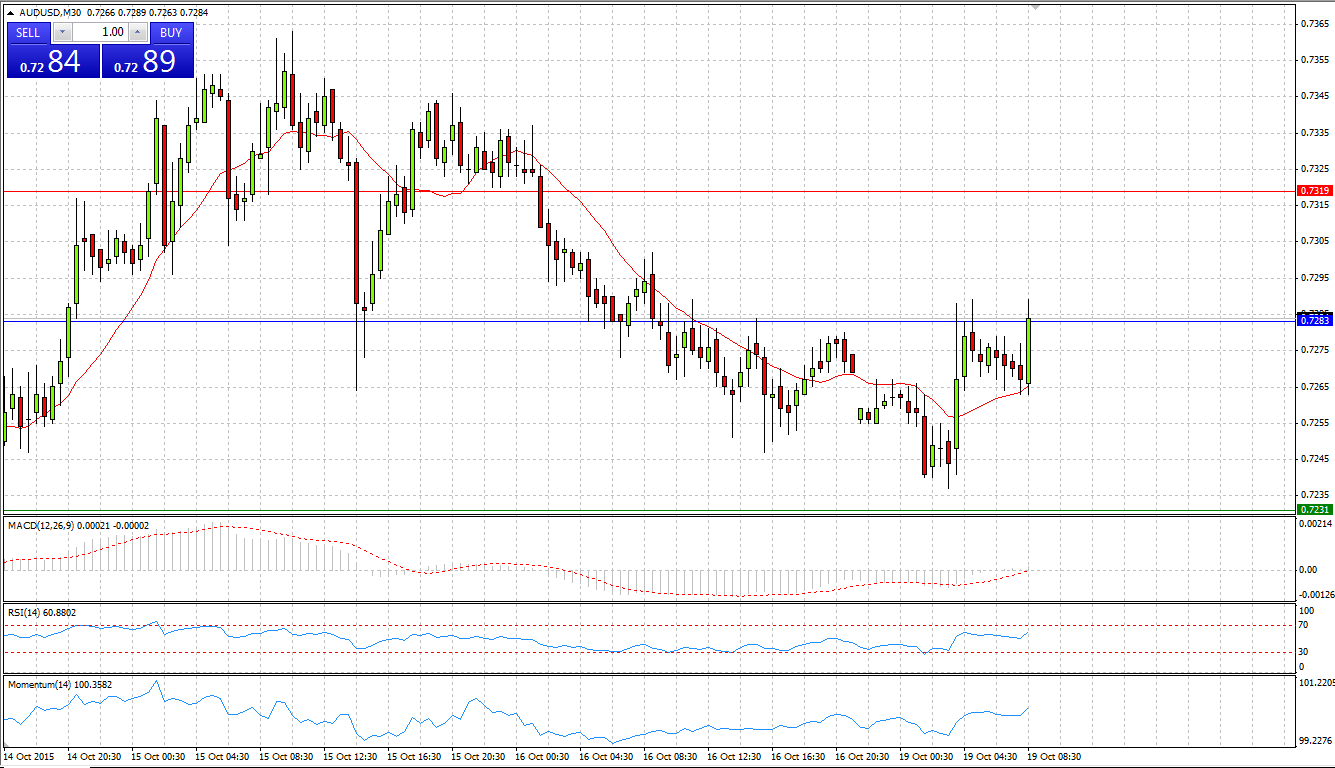
Market Scenario 1: Long positions above 135.51 with targets at 136.06 and 136.54
Market Scenario 2: Short positions below 135.51 with targets at 135.03 and 134.48
Comment: During Friday’s session, the European currency recovered some of the losses incurred on Thursday. Now, EUR/JPY is trading slightly above Pivot Point level. With the absence of economic data today, it is expected that the currency pair will trade flat.
Supports and Resistances:
R3 137.09
R2 136.54
R1 136.06
PP 135.51
S1 135.03
S2 134.48
S3 134.00
EUR/USD
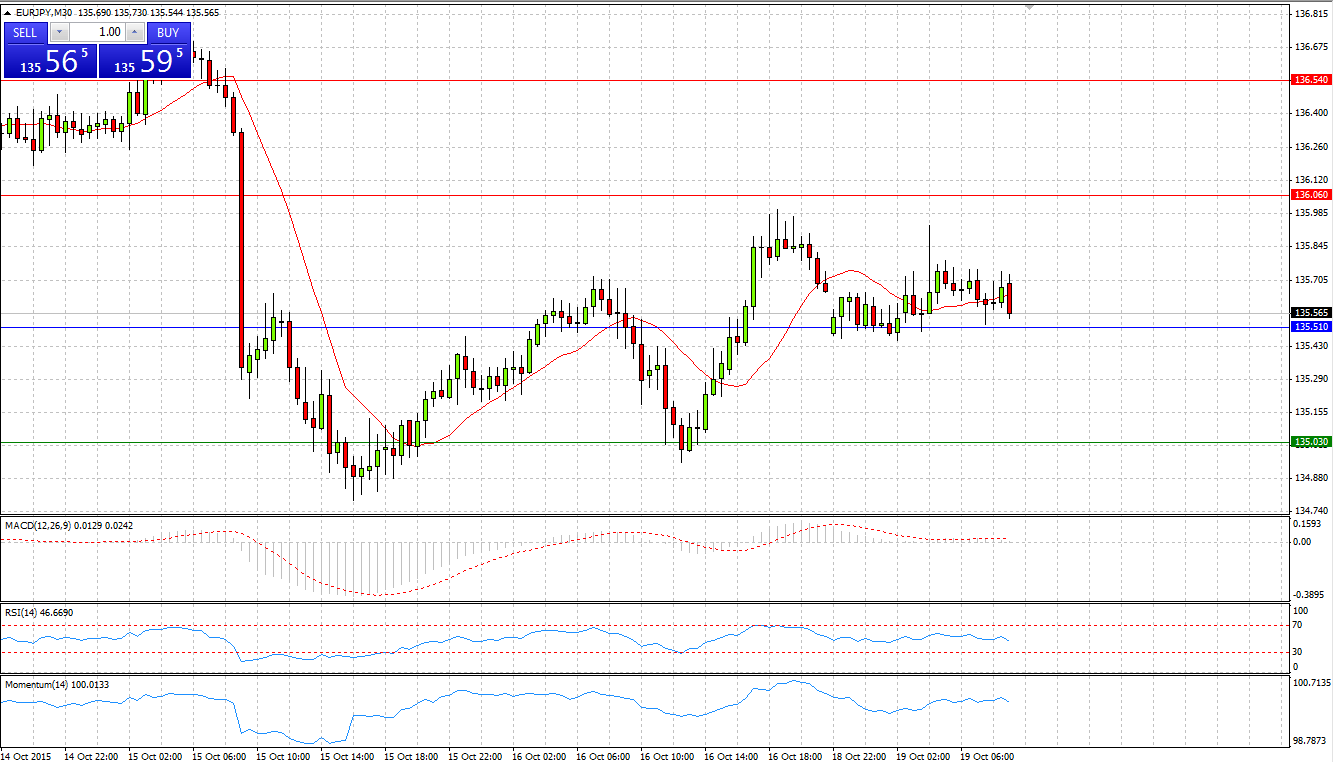
Market Scenario 1: Long positions above 1.1359 with targets at 1.1383 and 1.1419
Market Scenario 2: Short positions below 1.1359 with targets at 1.1323 and 1.1323
Comment: European currency continues to fall against US dollar amid positive economic data from US. University of Michigan’s preliminary consumer sentiment index released on Friday indicated an increase in consumer sentiment, for the first time in four months. The rebound in confidence signifies consumers have concluded that the fears expressed on Wall Street did not extend to Main Street. Today, EUR/USD is trading below Pivot Point level, finding support of mid-first support level.
Supports and Resistances:
R3 1.1443
R2 1.1419
R1 1.1383
PP 1.1359
S1 1.1323
S2 1.1299
S3 1.1263
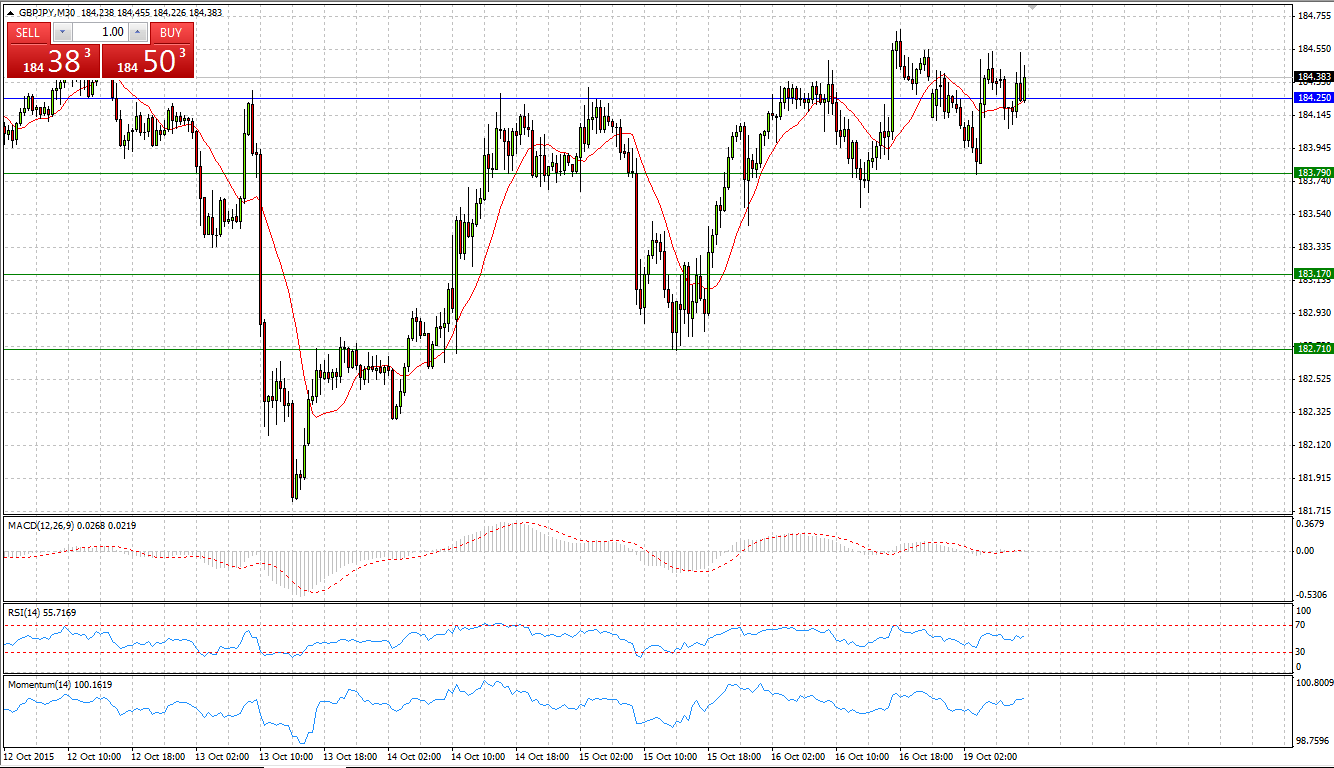
GBP/JPY
Market Scenario 1: Long positions above 184.25 with targets at 184.87 and 185.33
Market Scenario 2: Short positions below 184.25 with targets at 183.79 and 183.17
Comment: GBP/JPY made a full recovery of the losses incurred on Thursday and is trading close to its highs. If sterling manages to break through the first resistance level, it will indicate a possible hike to R2 and R3
Supports and Resistances:
R3 185.95
R2 185.33
R1 184.87
PP 184.25
S1 183.79
S2 183.17
S3 182.71
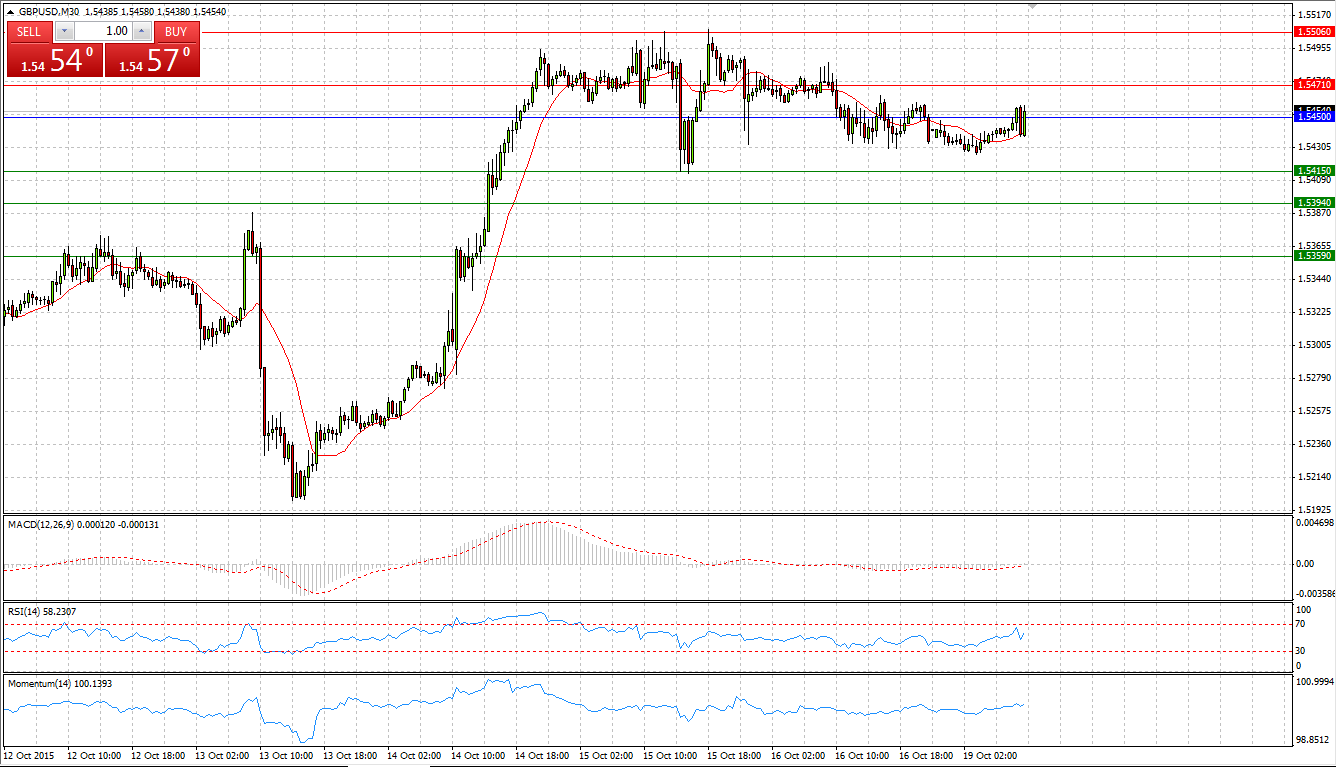
GBP/USD
Market Scenario 1: Long positions above 1.5465 with targets at 1.5517 and 1.5558
Market Scenario 2: Short positions below 1.5465 with targets at 1.5424 and 1.5372
Comment: After its biggest one-day rally on Wednesday, GBP/USD was trading flat with a small correction during Thursday’s and Friday’s sessions. Currently, GBP/USD is trading flat slightly above Pivot Point level.
Supports and Resistances:
R3 1.5527
R2 1.5506
R1 1.5471
PP 1.5450
S1 1.5415
S2 1.5394
S3 1.5359
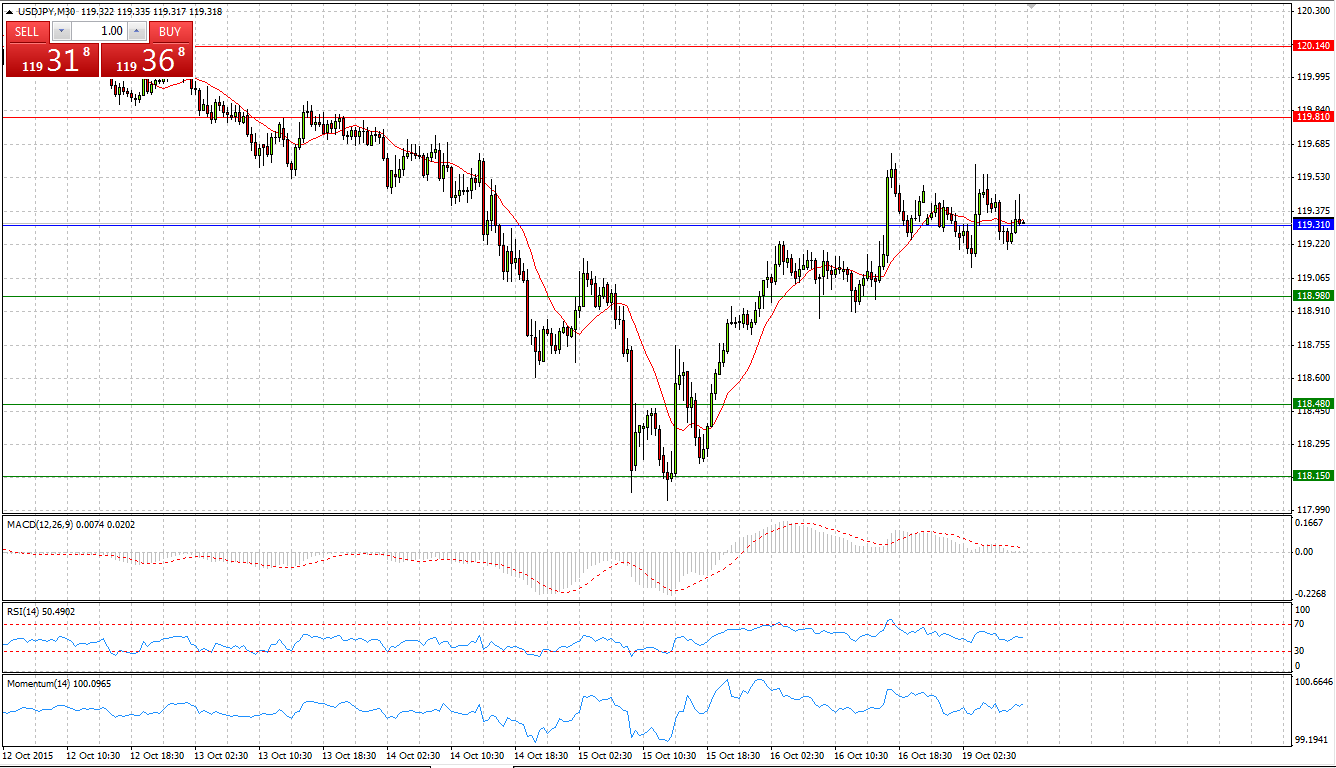
USD/JPY
Market Scenario 1: Long positions above 119.31 with targets at 119.81 and 120.14
Market Scenario 2: Short positions below 119.31 with targets at 118.98 and 118.48
Comment: After a heavy sell-off during Wednesday’s session, USD/JPY is slowly recovering and trying to climb back to its recent trading range between 119.3 and 121. However, the pair has encountered selling pressure slightly above Pivot Point level, yet succeeded to break through mid-Pivot Point level at 119.5 and R1 which will open the way to the highs of the recent trading range at 121 Japanese yen per US dollar.
Supports and Resistances:
R3 120.64
R2 120.14
R1 119.81
PP 119.31
S1 118.98
S2 118.48
S3 118.15
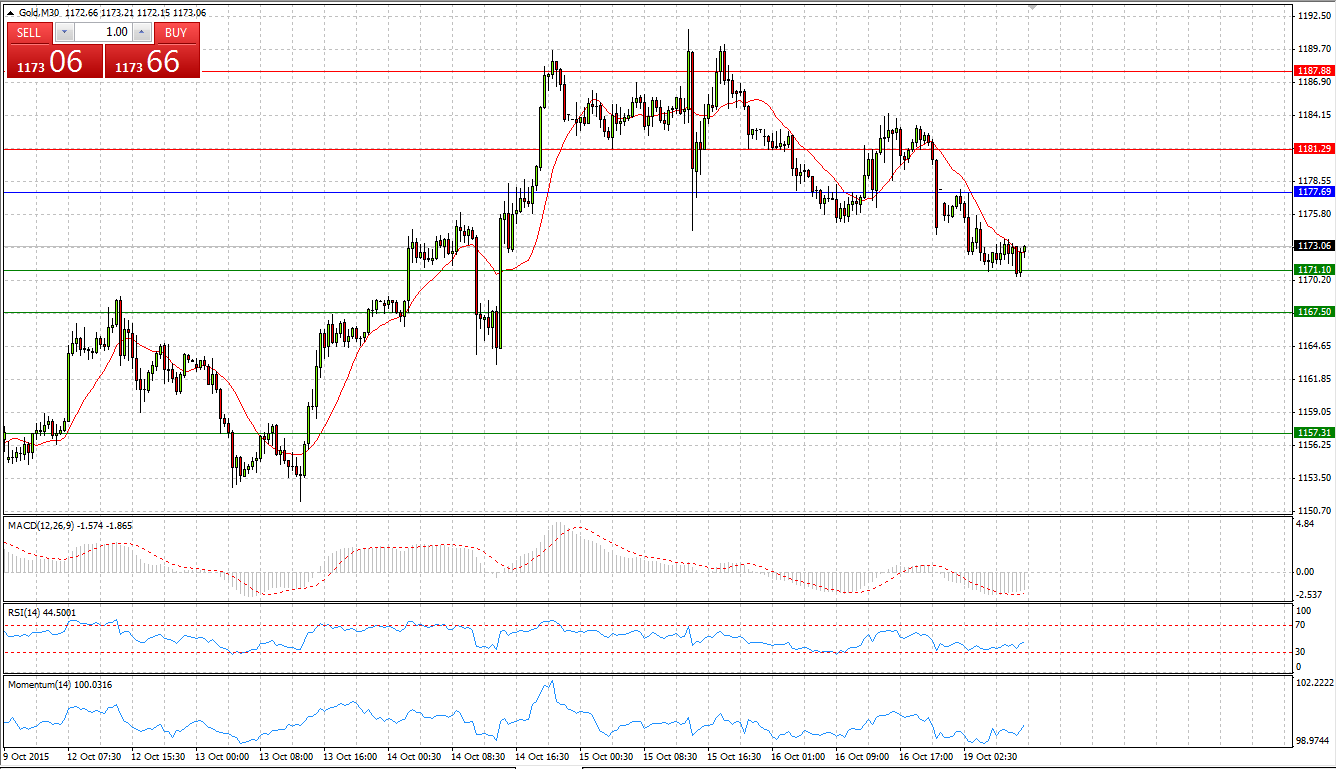
GOLD
Market Scenario 1: Long positions above 1171.10 with targets at 1177.69 and 1181.29
Market Scenario 2: Short positions below 1171.10 with targets at 1167.50 and 1167.50
Comment: Gold depreciated against US dollar amid positive US economic data, which showed that consumer sentiment climbed more than expected in October as lower-income, Americans projected wage gains will accelerate and falling energy prices helped stretch paychecks. Currently the bullion is trading below Pivot Pint level, finding support at first support level.
Supports and Resistances:
R3 1198.07
R2 1187.88
R1 1181.29
PP 1177.69
S1 1171.10
S2 1167.50
S3 1157.31
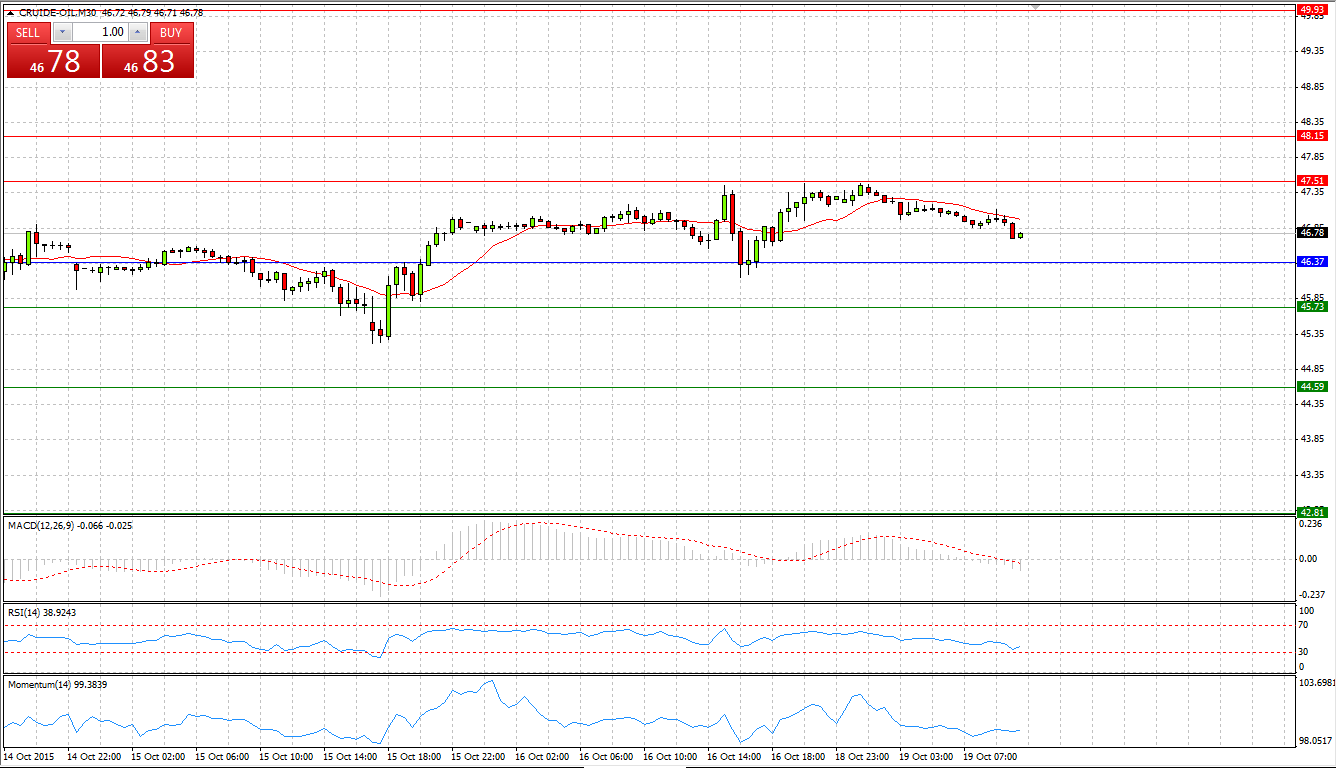
CRUDE OIL
Market Scenario 1: Long positions above 46.94 with targets at 47.73 and 48.27
Market Scenario 2: Short positions below 46.94 with targets at 46.40 and 45.61
Comment: During early Asian session, crude oil came under selling pressure, losing approximately 50 cent a barrel. However, crude is trading above Pivot point level.
Supports and Resistances:
R3 49.60
R2 48.27
R1 47.73
PP 46.94
S1 46.40
S2 45.61
S3 44.28
USD/RUB
Market Scenario 1: Long positions above 61.21 with targets at 62.60 and 63.68
Market Scenario 2: Short positions below 61.21 with targets at 60.13 and 58.73
Comment: USD/RUB continues trading in the range between S1 and R1, slightly lower Pivot Point level.
Supports and Resistances:
R3 66.16
R2 63.68
R1 62.60
PP 61.21
S1 60.13
S2 58.73
S3 56.26
