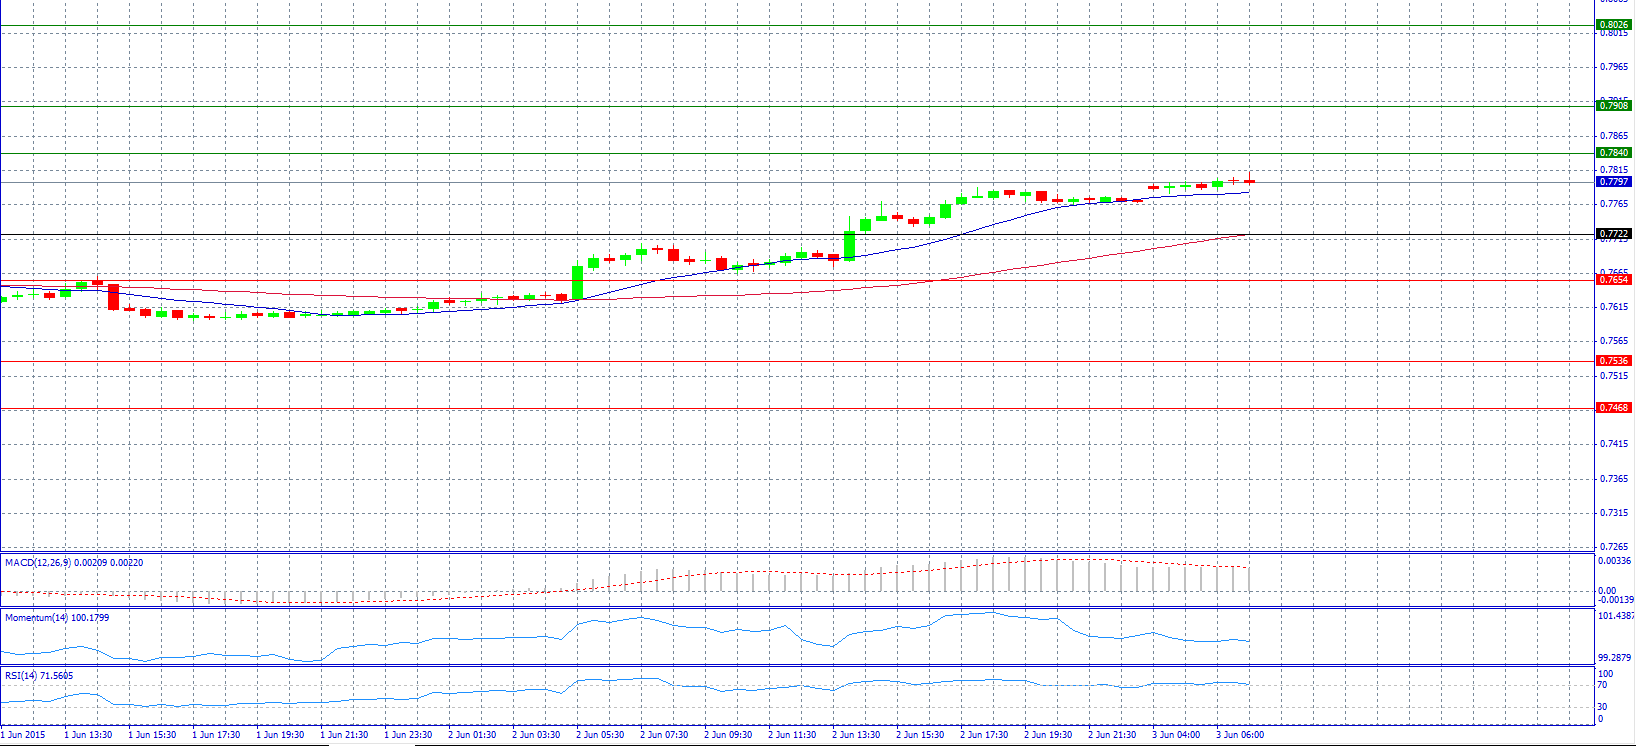
Market Scenario 1: Long positions above 0.7840 with target at 0.7908.
Market Scenario 2: Short positions below 0.7722 with target at 0.7654.
Comment: The pair climbed higher than expected due to Australia's Q1 GDP.
Supports and Resistances:
R3 0.8026
R2 0.7908
R1 0.7840
PP 0.7722
S1 0.7654
S2 0.7536
S3 0.7468
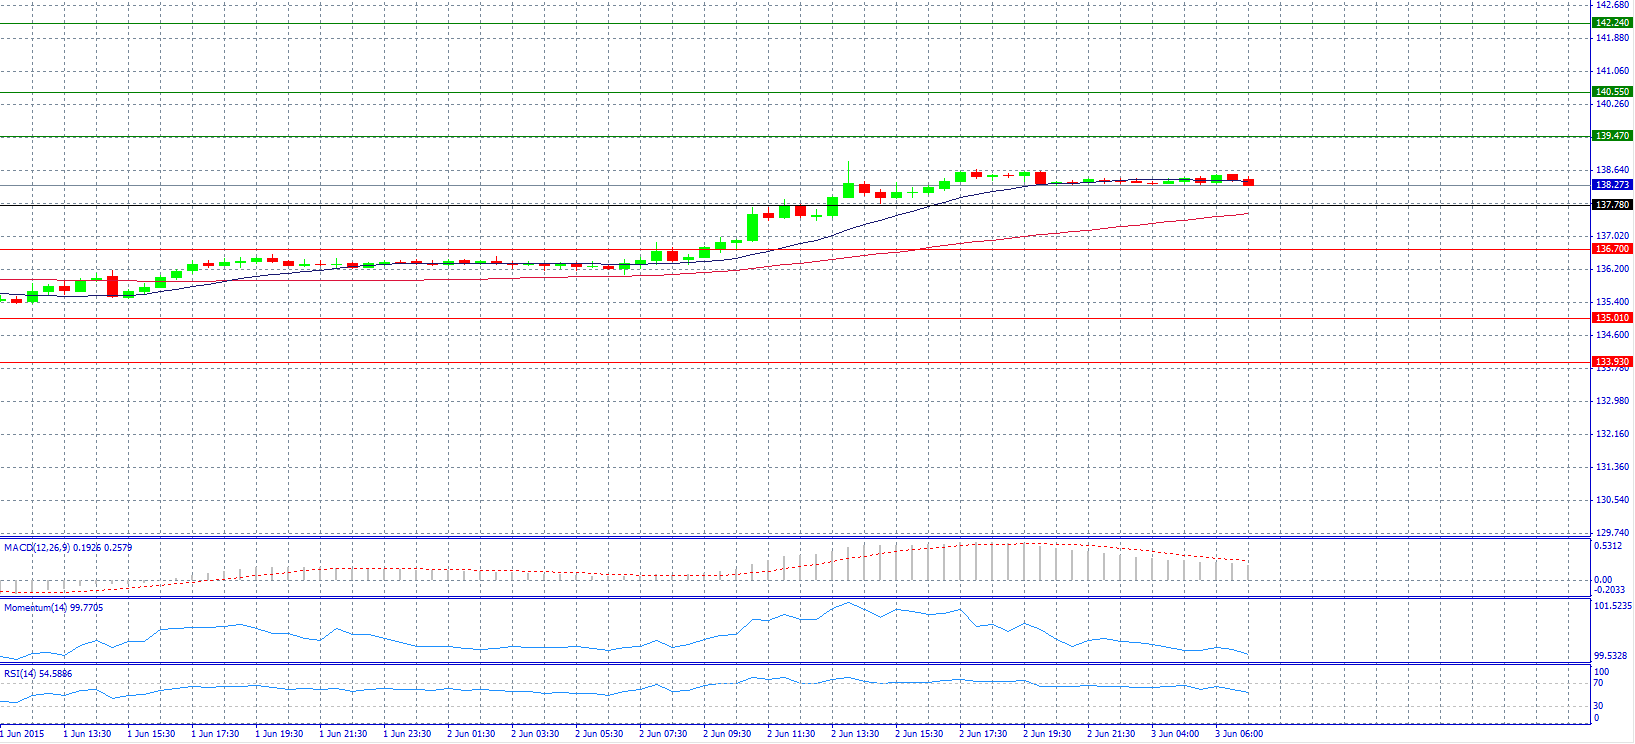
Market Scenario 1: Long positions above 139.47 with target at 140.55.
Market Scenario 2: Short positions below 137.78 with target at 136.70.
Comment: The pair trade neutral near 138.30 level.
Supports and Resistances:
R3 142.24
R2 140.55
R1 139.47
PP 137.78
S1 136.70
S2 135.01
S3 133.93
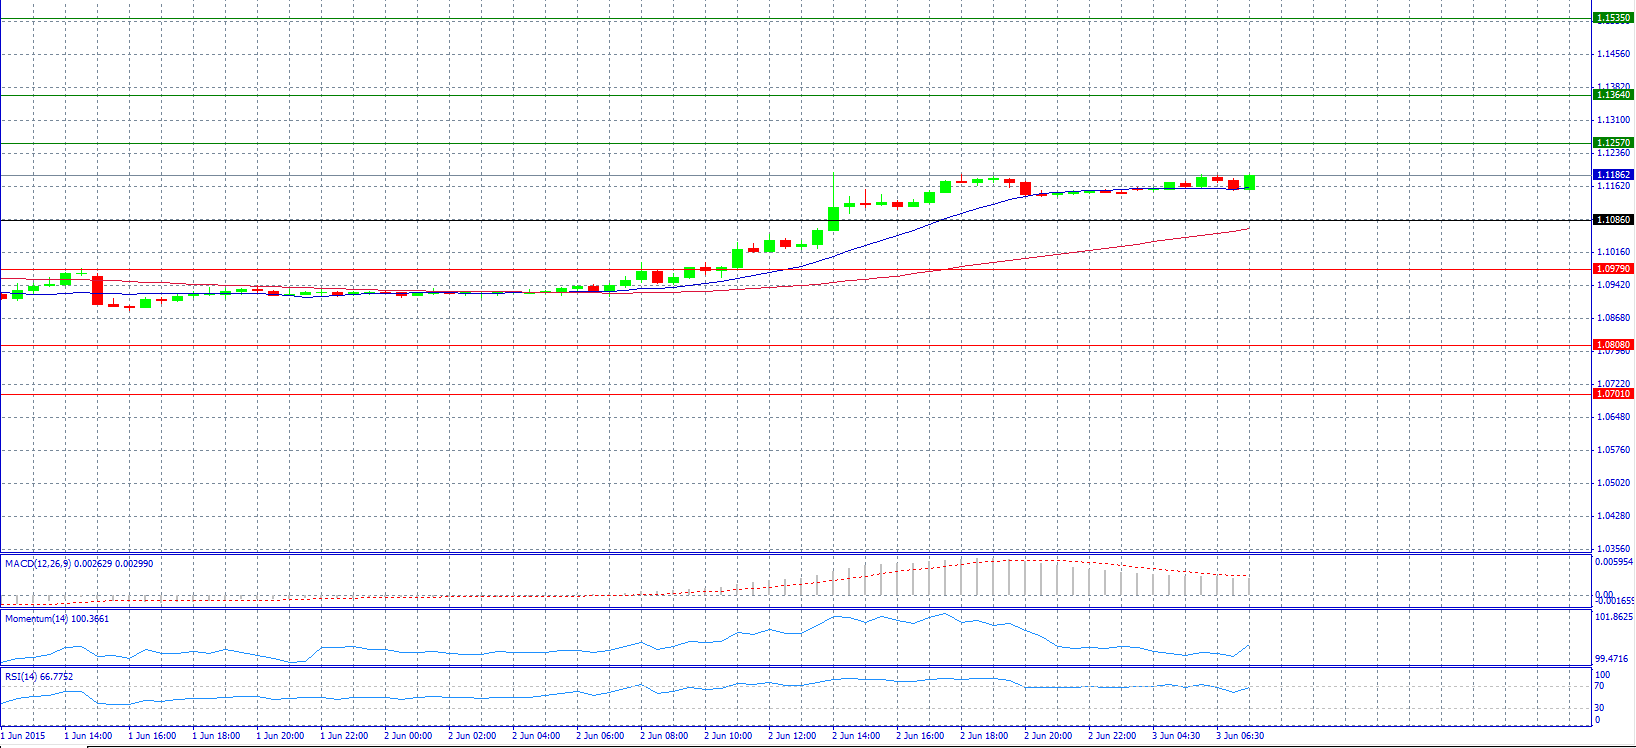
Market Scenario 1: Long positions above 1.1257 with target at 1.1364.
Market Scenario 2: Short positions below 1.1086 with target at 1.0979.
Comment: The pair may attempt to reach for 1.1200 again, with initial support expected towards the 100-day MA (1.1079) pending the ECB meeting, according to analysts.
Supports and Resistances:
R3 1.1535
R2 1.1364
R1 1.1257
PP 1.1086
S1 1.0979
S2 1.0808
S3 1.0701
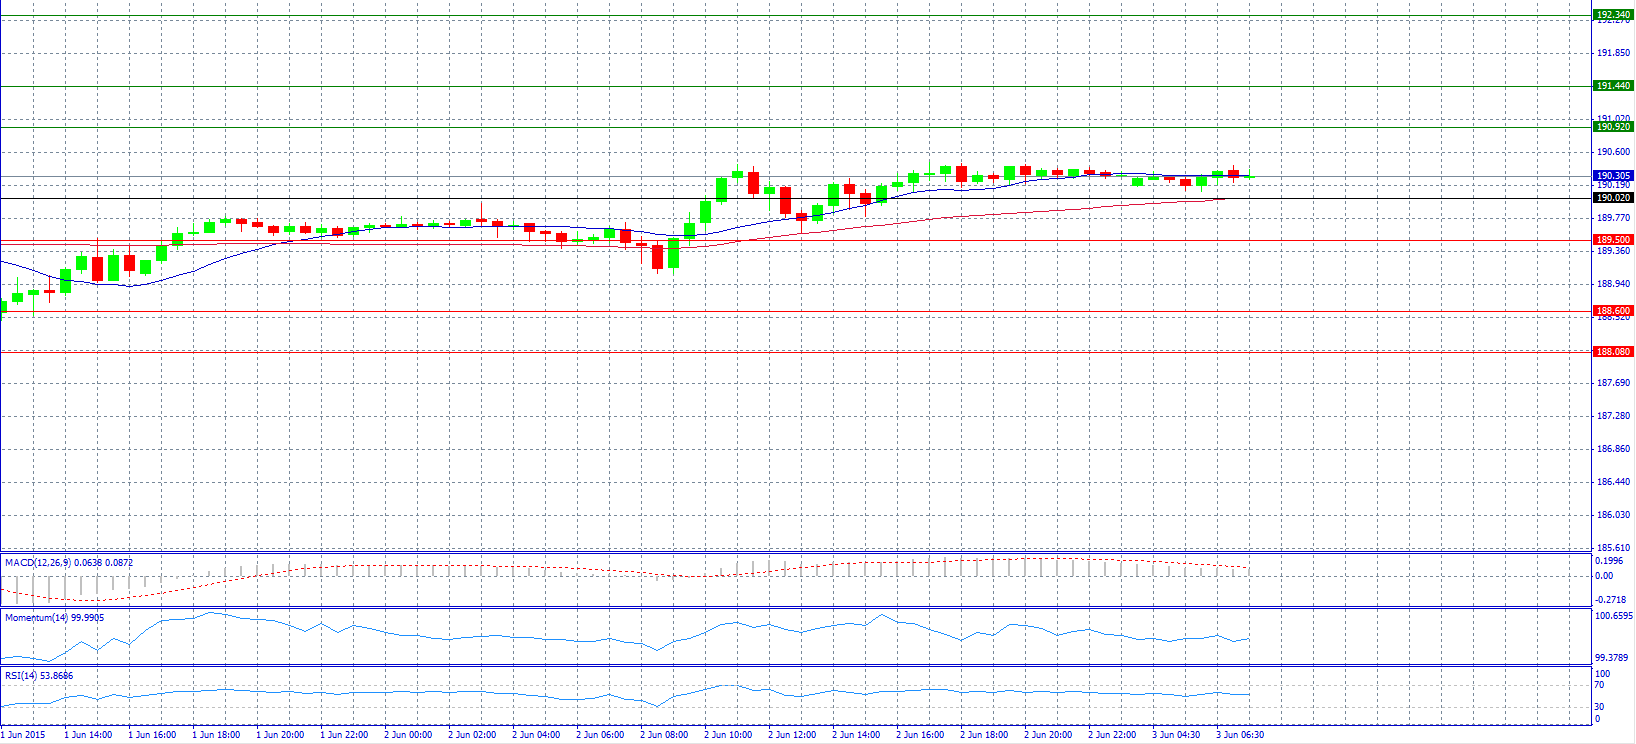
Market Scenario 1: Long positions above 190.92 with target at 191.44.
Market Scenario 2: Short positions below 190.02 with target at 189.50.
Comment: The pair trades unchanged for the moment near 190.30 level.
Supports and Resistances:
R3 192.34
R2 191.44
R1 190.92
PP 190.02
S1 189.50
S2 188.60
S3 188.08
Market Scenario 1: Long positions above 1.5413 with target at 1.5483.
Market Scenario 2: Short positions below 1.5296 with target at 1.5226.
Comment: The pair might extend gains towards 1.5417, according to analysts.
Supports and Resistances:
R3 1.5600
R2 1.5483
R1 1.5413
PP 1.5296
S1 1.5226
S2 1.5109
S3 1.5039

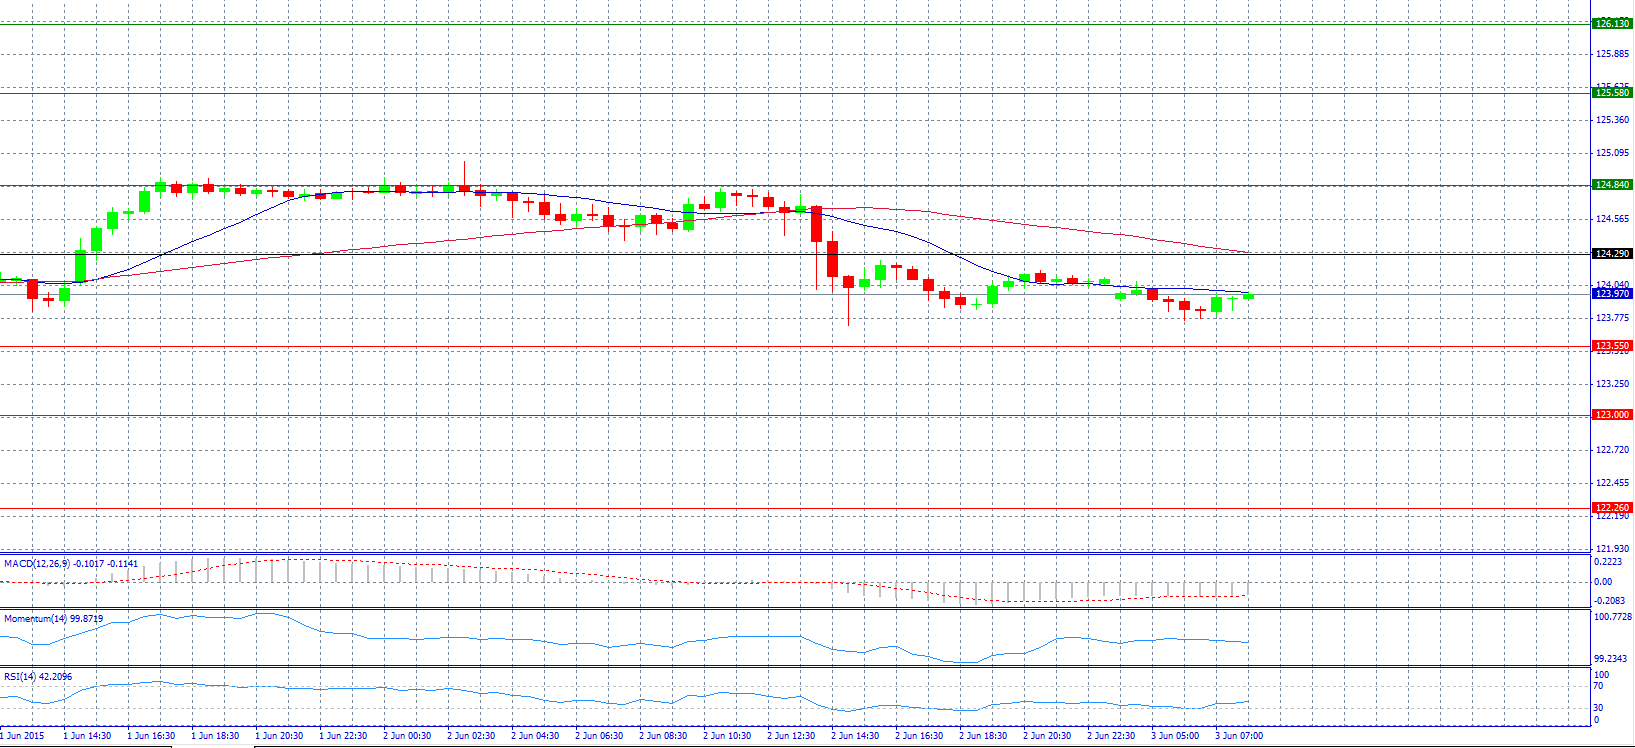
Market Scenario 1: Long positions above 124.29 with target at 124.84.
Market Scenario 2: Short positions below 123.55 with target at 123.00.
Comment: The pair might remain in the low to mid-120s for the next year, though it will be subject to inevitable spikes around US economic and/or Fed optimism, according to analysts’ forecast.
Supports and Resistances:
R3 126.13
R2 125.58
R1 124.84
PP 124.29
S1 123.55
S2 123.00
S3 122.26
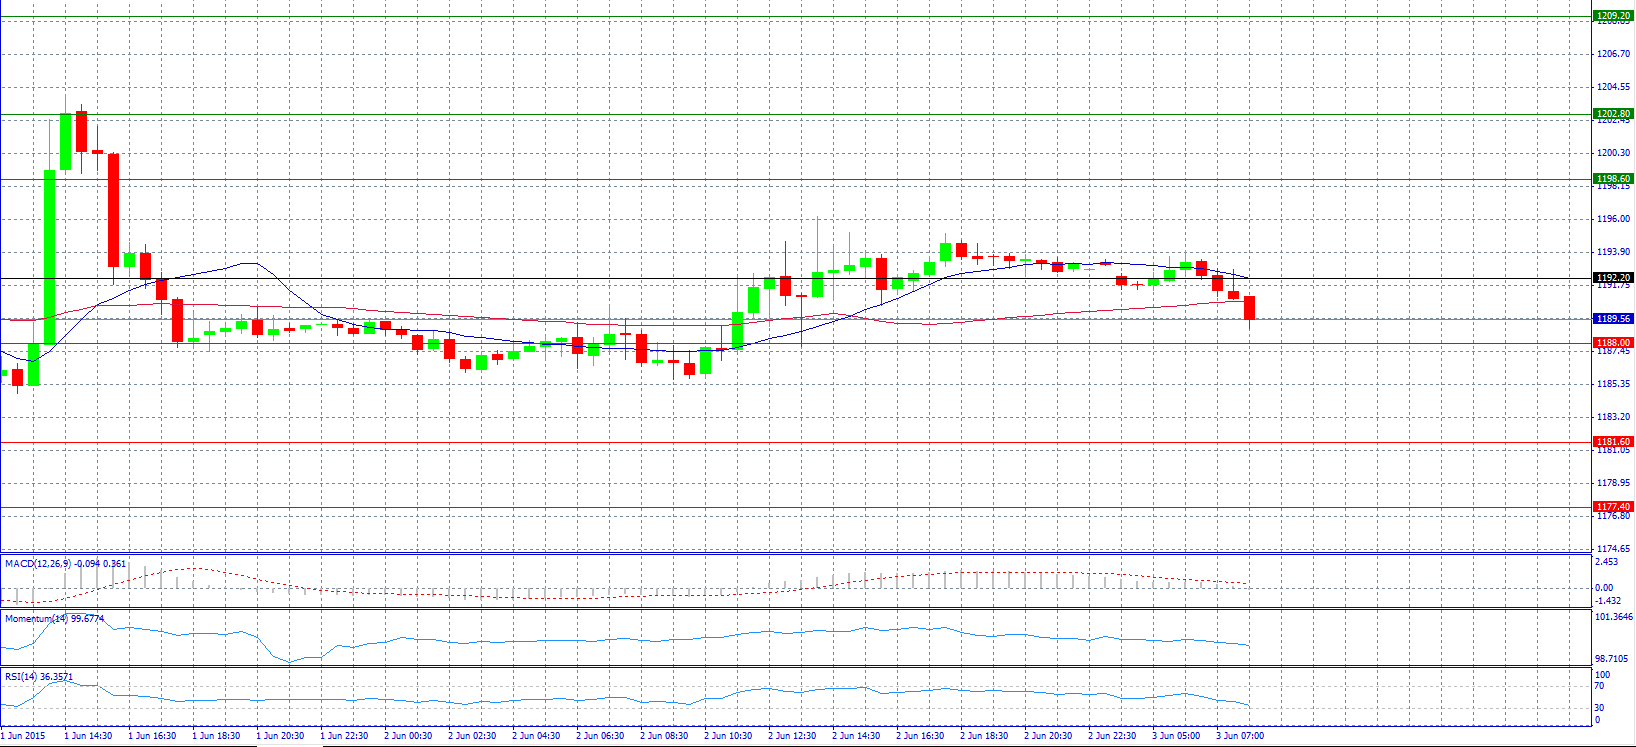
Market Scenario 1: Long positions above 1192.20 with target at 1198.60.
Market Scenario 2: Short positions below 1188.00 with target at 1181.60.
Comment: Gold prices weakened in Asia amid Greek debt talks.
Supports and Resistances:
R3 1209.20
R2 1202.80
R1 1198.60
PP 1192.20
S1 1188.00
S2 1181.60
S3 1177.40
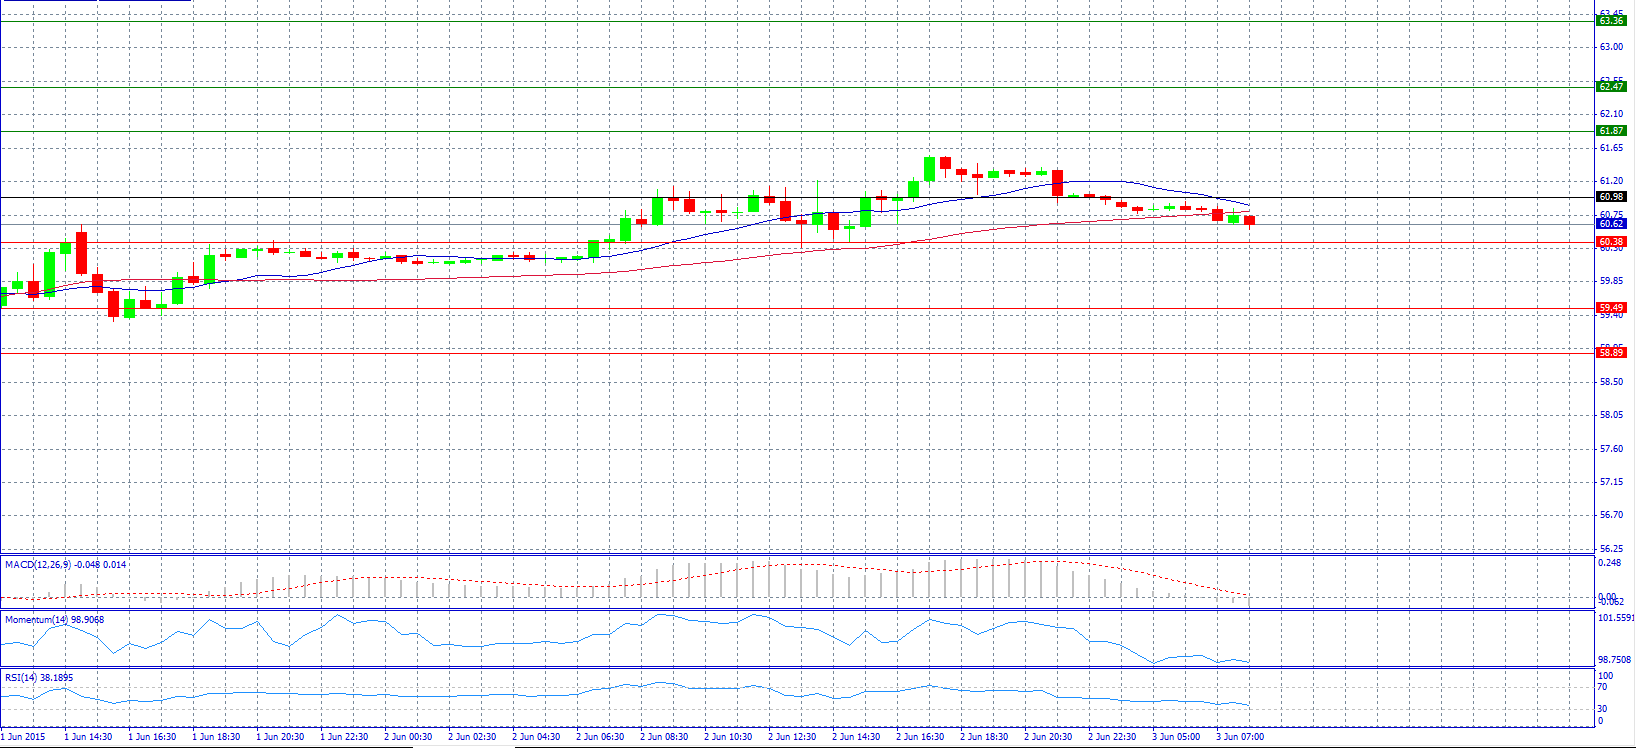
Market Scenario 1: Long positions above 60.98 with target at 61.87.
Market Scenario 2: Short positions below 60.38 with target at 59.49.
Comment: Crude oil prices might increase because supply from shale drilling in the U.S. won’t be enough to meet increasing global demand, according to Royal Dutch Shell (LONDON:RDSa) Plc.
Supports and Resistances:
R3 63.36
R2 62.47
R1 61.87
PP 60.98
S1 60.38
S2 59.49
S3 58.89
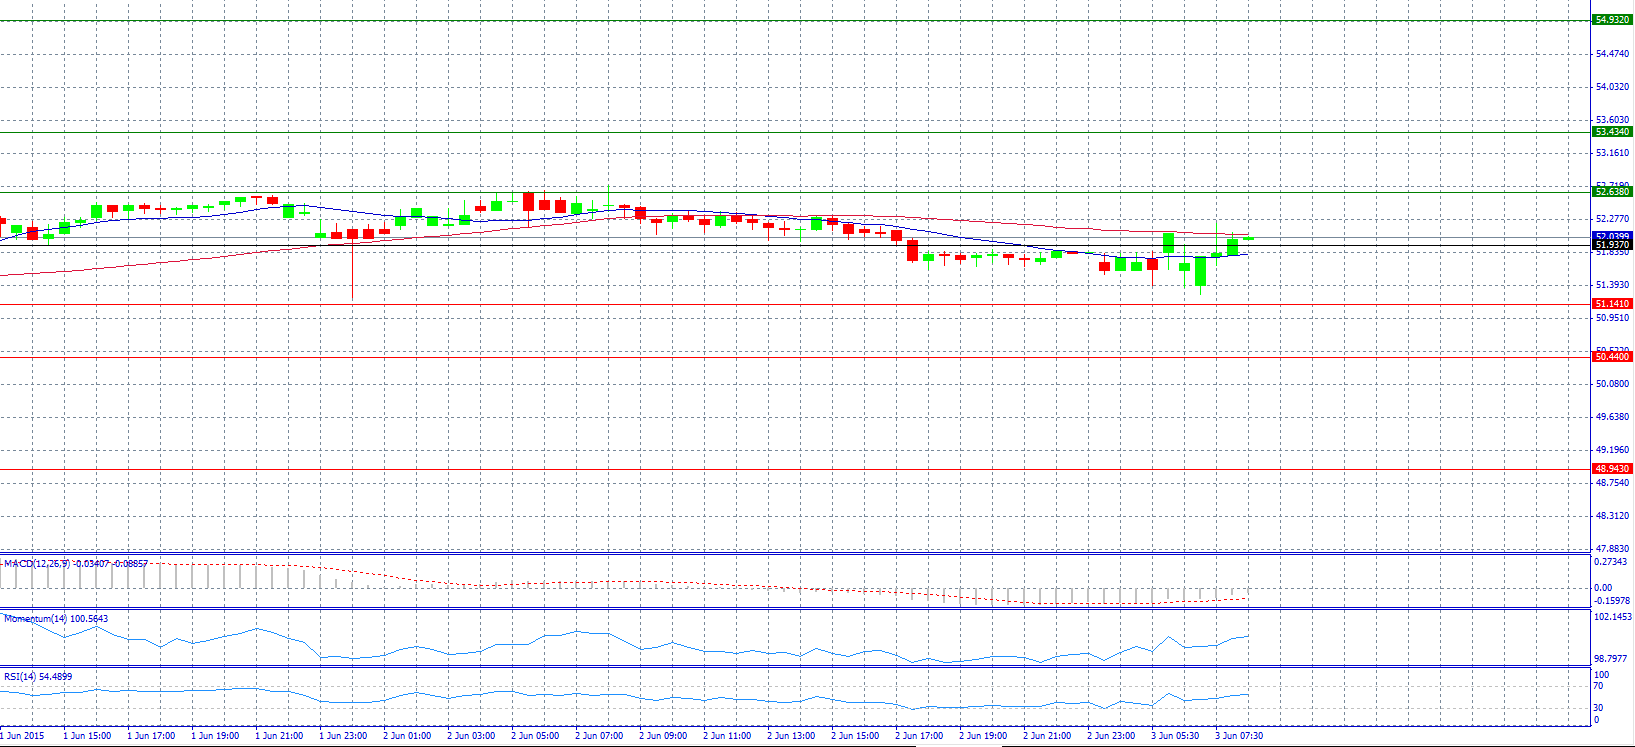
Market Scenario 1: Long positions above 51.937 with target at 52.638.
Market Scenario 2: Short positions below 51.937 with target at 51.141.
Comment: The pair struggles to stay above pivot point 51.937.
Supports and Resistances:
R3 54.932
R2 53.434
R1 52.638
PP 51.937
S1 51.141
S2 50.440
S3 48.943
