ECB meeting and US Non-farm Payrolls this week
On Tuesday the euro corrected up snapping the 4-day losing streak and having hit a fresh 7.5 year low. Strong EU macroeconomic statistics puts in doubt the further euro weakening even in case ECB expands the monetary stimulus programme. Amid this news the US economic indicators look not that bright. Will the EUR USD pair continue strengthening?
In the recent 6 weeks the euro slumped 8% against the US dollar as the markets reacted on the ECB plans to expand the volume of QE programme and to extend it. This matter will be discussed on the next Bank’s meeting on December 3. Currently the bank is buying 60bn euros a month.
There is not much time left till the meeting and some investors may close the shorts guided by the saying “sell rumours, buy facts”. Besides such a technical reason, the strong macroeconomic data could have significantly improved the sentiment.
The November unemployment fell to 6.3% in Germany which is the lowest since the German reunification in 1990. Meanwhile, the industrial production growth in Eurozone was the highest in 19 months. The export orders, which are the part of the industrial PMI, reached the highest in 6 months.
Given such positive news, some investors start talking about the probable euro strengthening, especially in case the ECB leaves the QE programme unchanged. The Bank’s decision will rely upon the November inflation in Eurozone due on December 2. Its slight increase is expected which does not favour the further monetary easing by ECB.
Amid this European positive, the US dollar index live data show the index bounced off its 8.5-month high. On Tuesday the US ISM Manufacturing for November slumped unexpectedly to the lowest since June 2009. The key US statistics is to come out this Friday when the November Non-farm Payrolls will be released. In our opinion, the tentative outlook is neutral but if it does not come true the euro will find a strong support.

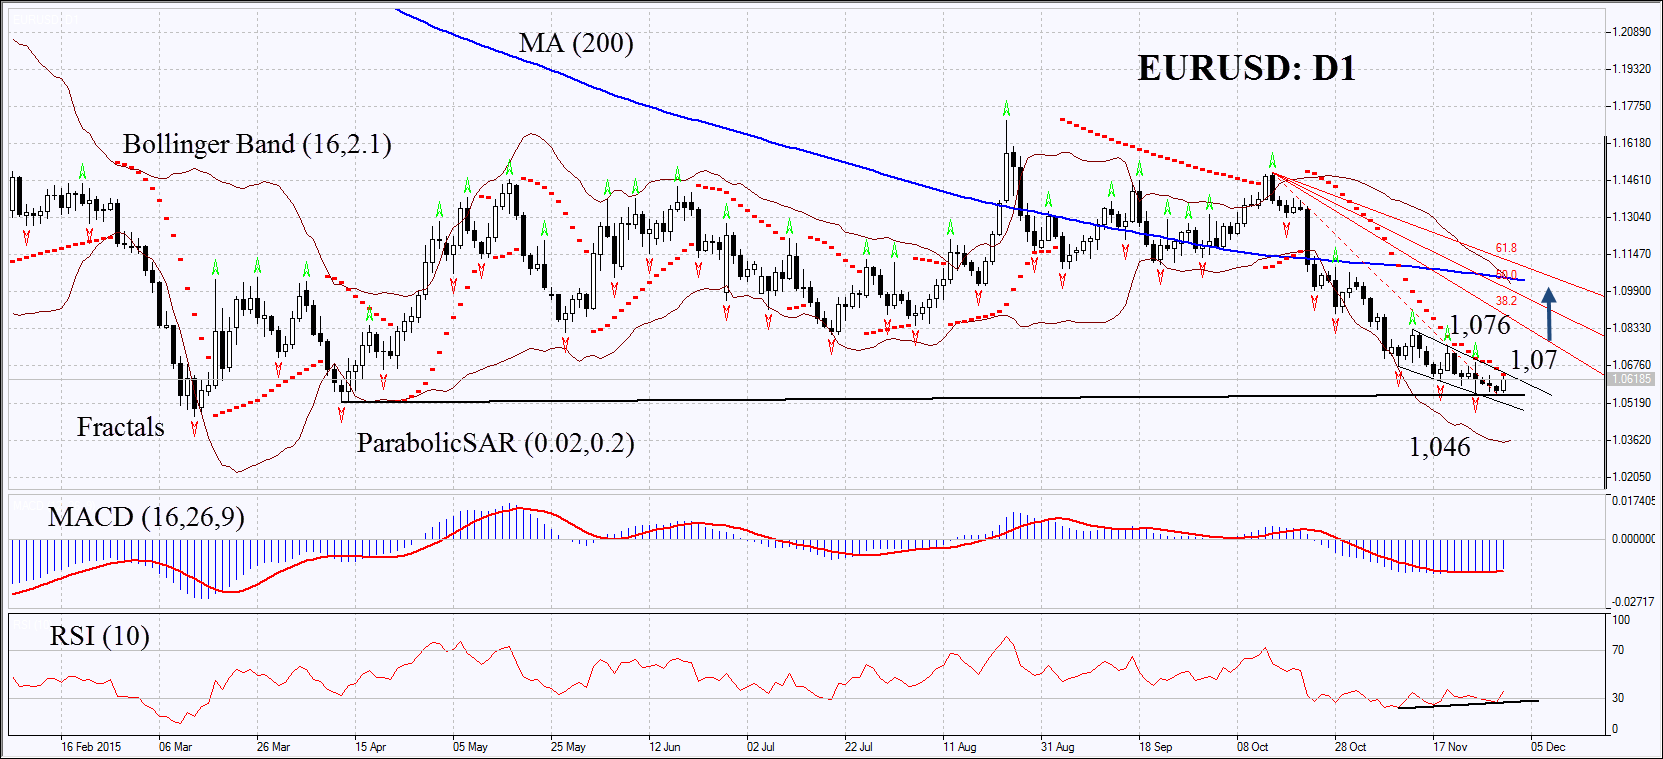
On the daily chart the EUR/USD: D1 is consolidated near the 13-year low. The Parabolic indicator continues giving sell signal while MACD has formed the buy signal. The Bollinger bands have widened significantly which may mean higher volatility. RSI has formed the positive divergence. The bullish trend may develop in case the euro surpasses the first or second fractal at 1.07 or 1.076. This level may serve the point of entry. The initial risk limit may be placed below the 13-year low at 1.046. Having opened the pending order we shall move the stop to the next fractal low following the Parabolic and Bollinger signals. Thus, we are changing the probable profit/loss ratio to the breakeven point. The most risk-averse traders may switch to the 4-hour chart after the trade and place there a stop-loss moving it in the direction of the trade. If the price meets the stop-loss level at 1.046 without reaching the order at 1.076 or 1.07, we recommend cancelling the position: the market sustains internal changes which were not taken into account.
PositionBuyBuy stopabove 1,076 or 1,07Stop lossbelow 1,046
