Get 40% Off
These stocks are up over 10% post earnings. Did you spot the buying opportunity? Our AI did.Read how

EUR/USD Technical Analysis: June 29th, 2015

Published 06/29/2015, 09:56 AM
Updated 12/18/2019, 06:45 AM

Greek-style crisis

The eurozone crisis continues. On Saturday, the Greek government and European creditors did not manage to come to a compromise on additional financial aid and credit easing. The financial bailout program expires on June 30th. We can literally assume that Greece is on the brink of default, while eurozone is close to a political crisis. The EUR/USD currency pair opened with a bearish gap on Monday. The price has been moving within the H4 and daily trends that both have a negative slope. The instrument has three times approached the support line at 1.12339, but has not yet crossed it. As a result, the bearish triple top pattern has been shaped. The Parabolic indicator has been moving inside the H4 corridor, confirming the trend. The RSI-Bars oscillator does not contradict our assumptions. We are expecting the next bar to close below the resistance level at 27%.
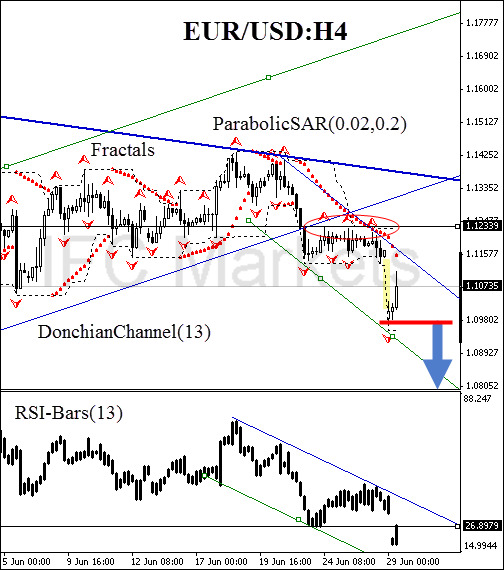
EUR/USD 4 Hour Chart

We believe that all the represented instruments have been giving sell signals. The terminal impulse is anticipated after breaching the 27% oscillator support, which corresponds to the Donchian Channel lower boundary and the fractal at 1.09802. A sell pending order may be placed at this mark. A stop loss may be placed at the channel opposite boundary at 1.12339. This level is supported by Parabolic historical values, the pattern and the trend line. The stop loss is supposed to be moved every four hours near the next fractal high, following Parabolic signals. Thus, we are changing the probable profit/loss ratio to the breakeven point.

Position Sell Sell stop below 1.09802 Stop loss above 1.12339

3rd party Ad. Not an offer or recommendation by Investing.com. See disclosure here or remove ads .

Latest comments

Risk Disclosure: Trading in financial instruments and/or cryptocurrencies involves high risks including the risk of losing some, or all, of your investment amount, and may not be suitable for all investors. Prices of cryptocurrencies are extremely volatile and may be affected by external factors such as financial, regulatory or political events. Trading on margin increases the financial risks.
Before deciding to trade in financial instrument or cryptocurrencies you should be fully informed of the risks and costs associated with trading the financial markets, carefully consider your investment objectives, level of experience, and risk appetite, and seek professional advice where needed.
Fusion Media would like to remind you that the data contained in this website is not necessarily real-time nor accurate. The data and prices on the website are not necessarily provided by any market or exchange, but may be provided by market makers, and so prices may not be accurate and may differ from the actual price at any given market, meaning prices are indicative and not appropriate for trading purposes. Fusion Media and any provider of the data contained in this website will not accept liability for any loss or damage as a result of your trading, or your reliance on the information contained within this website.
It is prohibited to use, store, reproduce, display, modify, transmit or distribute the data contained in this website without the explicit prior written permission of Fusion Media and/or the data provider. All intellectual property rights are reserved by the providers and/or the exchange providing the data contained in this website.
Fusion Media may be compensated by the advertisers that appear on the website, based on your interaction with the advertisements or advertisers.
© 2007-2024 - Fusion Media Limited. All Rights Reserved.