Soy dynamics diverse from other grain futures
Soy prices slumped on Tuesday amid improved outlook for crops in US and Brazil and mixed data in China. Soy fell less than 10% from its multi-month high reached in first half of June. Meanwhile the corn and wheat prices tumbled more than 20% while rice lost around 15%. Will the soy continue falling in price?
US Middle West suffers from rains after a spell of hot and dry weather and it may support grain crops. About 20% of crops still suffer from drought. Some market participants assume prices may fall further in case of rains in South-Eastern part of Iowa and Western Illinois. The price of corn and wheat fell to the lowest since 2006 in US Chicago Board of Trade. This could have happened on lower demand on biofuel amid cheap oil in global markets. Soy planting acreage may gain 3.5% to 34.3mln hectares in Brazil in this agricultural season. Meanwhile its crops are to reach 100mln tonnes and surpass the last-year level of 95.6mln tonnes. This June Brazil has cut soy exports by around 2mln tonnes compared to May and June 2015 which supported the prices. China is the world leading soy importer and accounts for around 64% of global soy imports followed by Japan and Mexico. The slowdown of the Chinese economy may cut demand for alimentary and commodities. The Chinese economic data came out mixed on Tuesday. As a result, some market participants began to doubt the monetary stimulus by the People’s Bank of China is effective enough. The Services PMI by Caixin/Markit rose in June 2016 to the 11-month high while the similar composite index which includes industrial production slumped to the 4-month low. The official June manufacturing production data will come out in China on July 15, they may be below the tentative outlook.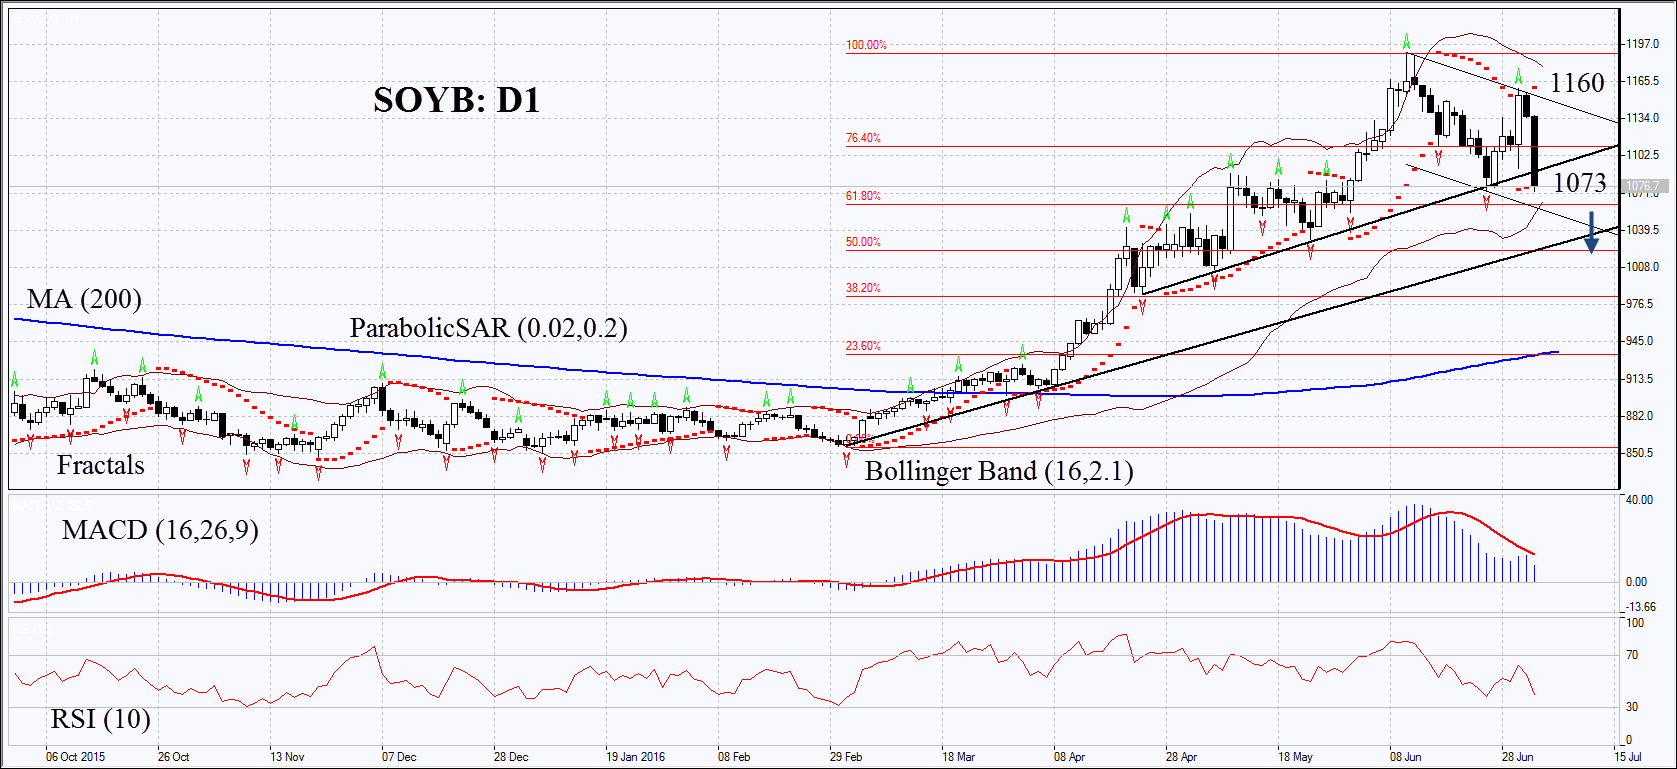
On the daily chart Soyb: D1 showed on Tuesday the record daily fall in 11 month having left the mid-term bullish trend. But it is still far from the year low. The MACD and Parabolic indicators have formed signals to sell. The Bollinger bands have narrowed which means lower volatility. The RSI is below 50 but has not yet reached the overbought zone. No divergence. The bearish momentum may develop in case the soy price falls below the last fractal low and the Parabolic signal at 1073. This level may serve the point of entry. The initial stop-loss may be placed above the Parabolic signal, the last fractal high and the line of the recently formed downtrend at 1160. Having opened the pending order we shall move the stop to the next fractal high following the Parabolic and Bollinger signals. Thus, we are changing the probable profit/loss ratio to the breakeven point. The most risk-averse traders may switch to the 4-hour chart after the trade and place there a stop-loss moving it in the direction of the trade. If the price meets the stop-loss level at 1160 without reaching the order at 1073, we recommend cancelling the position: the market sustains internal changes which were not taken into account.
PositionSellSell stopbelow 1073Stop lossabove 1160
- English (UK)
- English (India)
- English (Canada)
- English (Australia)
- English (South Africa)
- English (Philippines)
- English (Nigeria)
- Deutsch
- Español (España)
- Español (México)
- Français
- Italiano
- Nederlands
- Português (Portugal)
- Polski
- Português (Brasil)
- Русский
- Türkçe
- العربية
- Ελληνικά
- Svenska
- Suomi
- עברית
- 日本語
- 한국어
- 简体中文
- 繁體中文
- Bahasa Indonesia
- Bahasa Melayu
- ไทย
- Tiếng Việt
- हिंदी
Technical Analysis #C-SOYB : 2016-07-06
Published 07/06/2016, 09:53 AM
Updated 12/18/2019, 06:45 AM
Technical Analysis #C-SOYB : 2016-07-06

IFC Markets
3rd party Ad. Not an offer or recommendation by Investing.com. See disclosure here or
remove ads
.
Latest comments
Install Our App
Risk Disclosure: Trading in financial instruments and/or cryptocurrencies involves high risks including the risk of losing some, or all, of your investment amount, and may not be suitable for all investors. Prices of cryptocurrencies are extremely volatile and may be affected by external factors such as financial, regulatory or political events. Trading on margin increases the financial risks.
Before deciding to trade in financial instrument or cryptocurrencies you should be fully informed of the risks and costs associated with trading the financial markets, carefully consider your investment objectives, level of experience, and risk appetite, and seek professional advice where needed.
Fusion Media would like to remind you that the data contained in this website is not necessarily real-time nor accurate. The data and prices on the website are not necessarily provided by any market or exchange, but may be provided by market makers, and so prices may not be accurate and may differ from the actual price at any given market, meaning prices are indicative and not appropriate for trading purposes. Fusion Media and any provider of the data contained in this website will not accept liability for any loss or damage as a result of your trading, or your reliance on the information contained within this website.
It is prohibited to use, store, reproduce, display, modify, transmit or distribute the data contained in this website without the explicit prior written permission of Fusion Media and/or the data provider. All intellectual property rights are reserved by the providers and/or the exchange providing the data contained in this website.
Fusion Media may be compensated by the advertisers that appear on the website, based on your interaction with the advertisements or advertisers.
© 2007-2024 - Fusion Media Limited. All Rights Reserved.