USDA report came out
The USDA released the grains report where revised down the corn and soy harvest estimated and the wheat planting acreage. Will the soybeans continue gaining in price?
The US corn harvest estimates were lowered from 13.654bn to 13.601bn bushels for 2015/16 season. The average yield is expected to fall from 169.3 to 168.4 bushels an acre. However, the corn stocks estimates for later this season were revised up from 1.785bn to 1.802bn bushels. As to soybeans, the USDA lowered both indicators. The crop is forecasted to fall 51mln bushels to 3.93bn and the stocks for the end of the season to fall by 25mln bushels to 440mln. The soybeans output per acre may fall from 48.3 to 48 bushels an acre. The USDA has lowered the US winter wheat acreage estimates by 7.2% in 2016 compared to 2015 to the 6-year low of 36.609mln acres. This is 2mln acres below the most pessimistic outlook. Further, the USDA increased the forecast of wheat stockpiles by 30mln bushels to 941mln which is better than expected by market participants. Note, that the net short positions were formed for wheat, corn and soybeans, according to the US Commodity Futures Trading Commission. This means many traders had a bearish vision of the market by now they may have to switch to the longs.

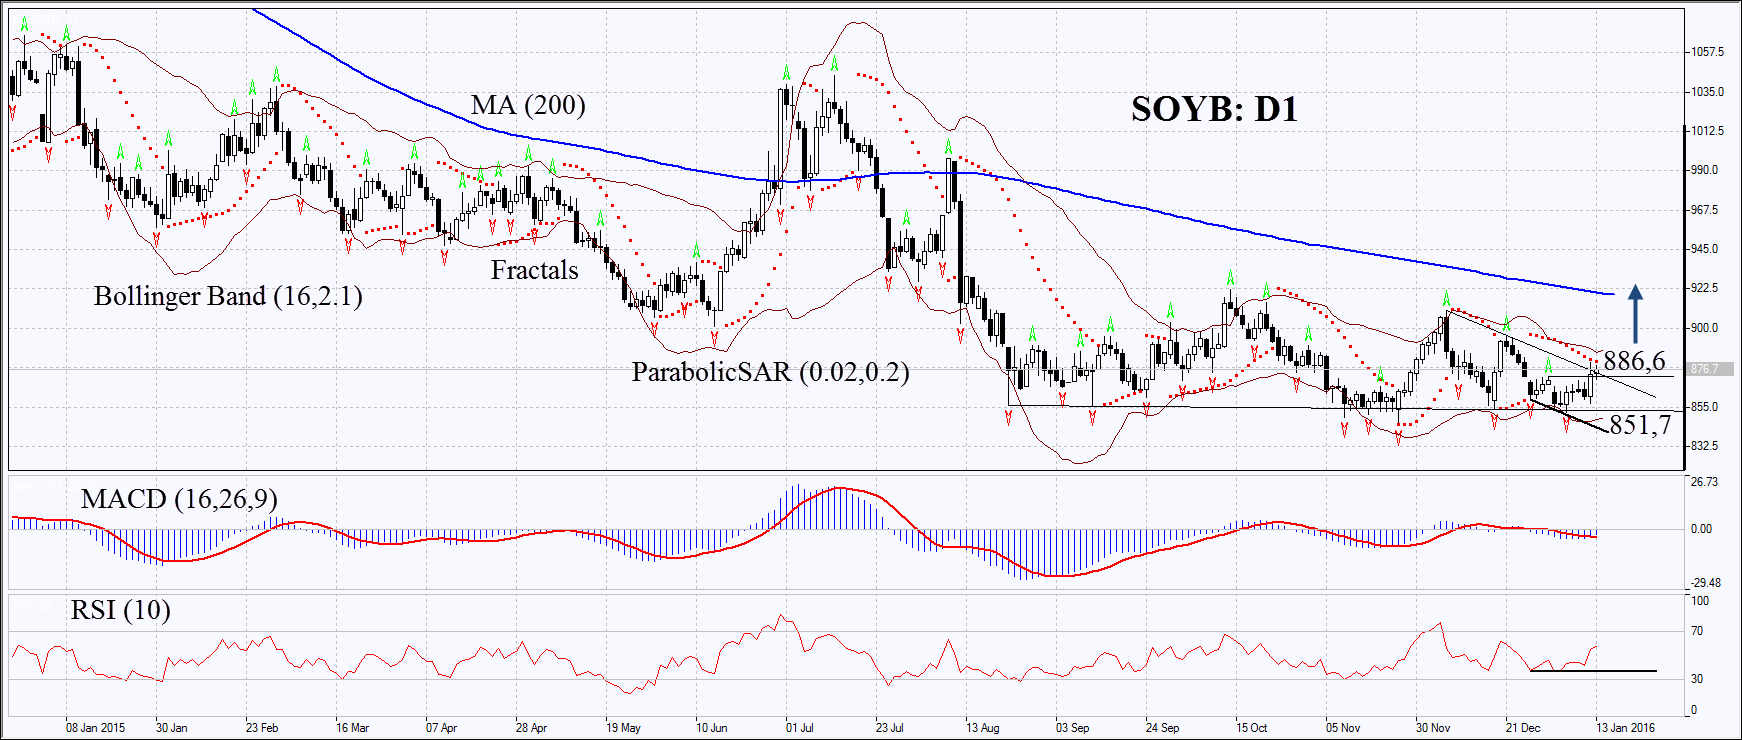
On the daily chart SOYB: D1 has been moving sideways for several months. Now it has surpassed the resistance of the short-term downtrend. The Parabolic indicator gives sell signals while MACD gives buy signals. The Bollinger bands® have contracted which may mean lower volatility. RSI has surpassed the level of 50 and has formed the positive divergence. The bullish momentum may form in case the soybeans price surpass the Bollinger band and the Parabolic signal at 886.6. This level may serve the point of entry. The initial risk limit may be placed below the last fractal low at 851.7. Having opened the pending order we shall move the stop following the Bollinger and Parabolic signals to the next fractal low. Thus, we are changing the potential profit/loss ratio to the breakeven point. The most risk-averse traders may switch to the H4 timeframe after the trade and place there stop-loss moving it in the direction of the market. If the price meets the stop-loss at 851.7 without reaching the order at 886.6 we recommend cancelling the position: the market sustains internal changes which were not taken into account.
Position Buy Buy stop above 886.6 Stop loss below 851.7
