US started LNG exports to Europe
The US began exporting LNG to Europe – the first tanker is to reach Portugal on April 26th. For the first time ever the US LNG was exported in this February to Brazil. After that the price for pipeline natural gas surged in the States. Will the gas prices continue edging up amid the planned geographic expansion and export volume increase? Now about 1.5% of US LNG production volume is exported.
In March the US natural gas prices fell to the lowest since 1999 and later rebounded 35% mainly due to the WTI oil surge by 56% since mid-January. Nevertheless, the US LNG exports to global market may give additional impetus to domestic US gas prices increase. As we see, they still fall behind the oil prices. The current gas price is around $75 per cubic metre in the US while the Europe purchases Russian gas for around $175 per cubic metre. Thus, the US gas will be in demand in Europe even with the transport, liquation and the further regasification costs included in price. According to the forecasts, the final price for Europe may be $4.3 per million British thermal units which is almost twice above the current US prices. On Thursday the data showed the US weekly gas stockpiles rose by 7bn cubic feet instead of the expected 3bn increase. Nevertheless, the increased stockpiles did not have a negative effect on prices. The Goldman Sachs (NYSE:GS) investment bank stated it expected the gradual gas prices rebound in the US not specifying the exact numbers. The U.S. Energy Information Administration predicts the domestic gas consumption is to reach 76.2bn cubic metres a day in 2016 and 77.6bn in 2017 in US. Last year the number was 75.3bn cubic feet a day.

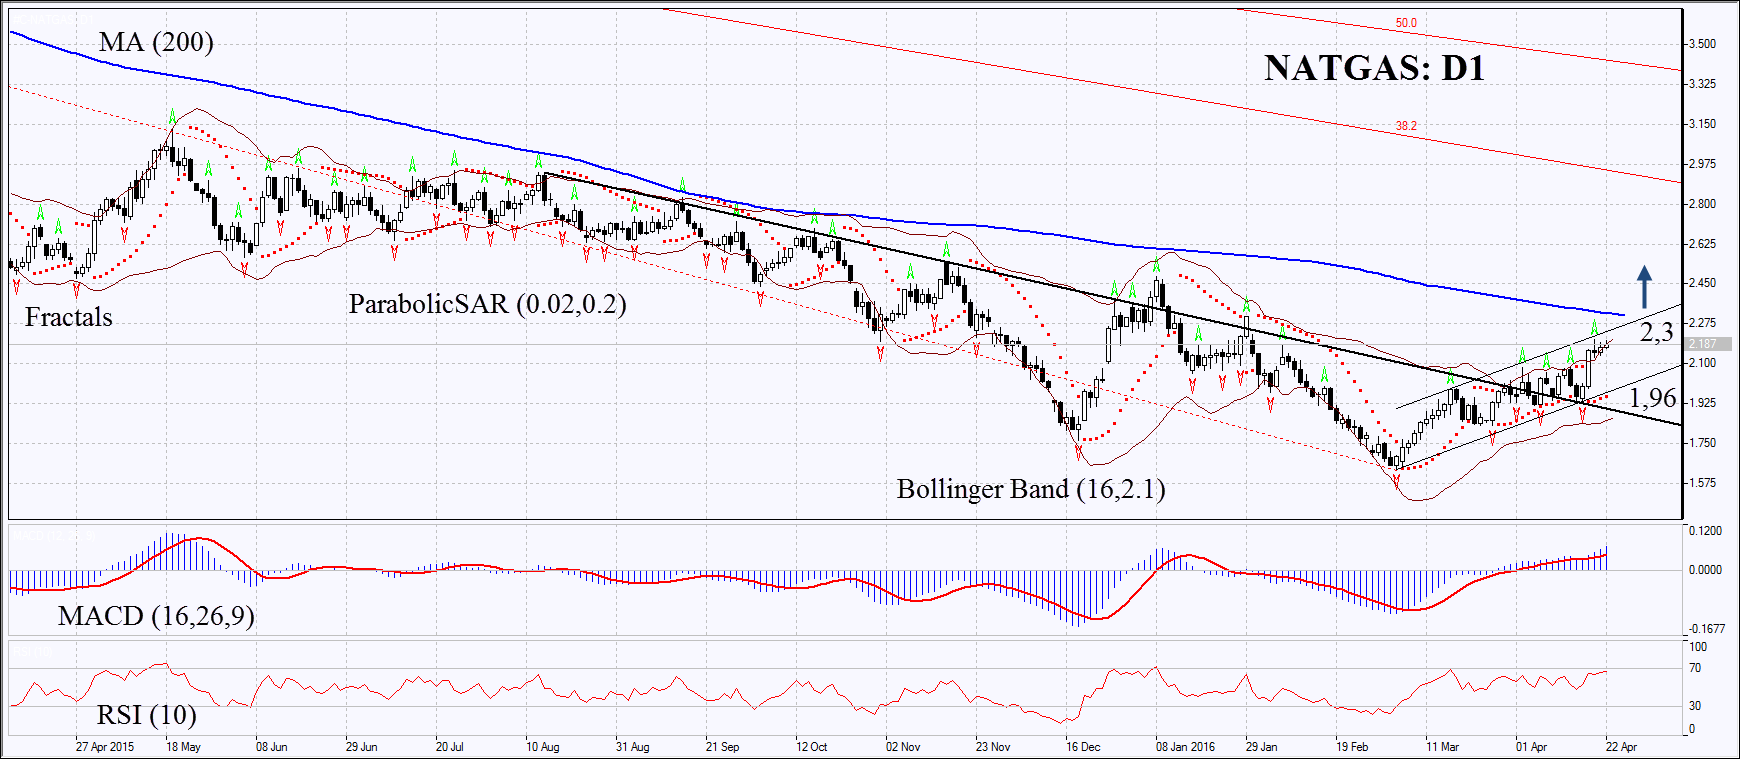
On the daily chart NATGAS: D1 has left the downtrend to move upwards. Now it is approaching the resistance of the uptrend and its 200-day moving average. The MACD and Parabolic indicators have formed the bullish signals. RSI is close to the overbought zone but has not reached it yet. No divergence. The Bollinger bands® have contracted which means lower volatility. Several latest candles closed above the Bollinger band. The bullish momentum may develop in case the natural gas price surpasses the last fractal high, the resistance and the 200-day moving average at 2.3. This level may serve the point of entry. The initial risk-limit may be placed below the Parabolic signal and the support of the uptrend at 1.96. Having opened the pending order we shall move the stop to the next fractal low following the Parabolic and Bollinger signals. Thus, we are changing the probable profit/loss ratio to the breakeven point. The most risk-averse traders may switch to the 4-hour chart after the trade and place there a stop-loss moving it in the direction of the trade. If the price meets the stop-loss level at 1.96 without reaching the order at 2.3 we recommend cancelling the position: the market sustains internal changes which were not taken into account.
Position Buy Buy stop above 2.3 Stop loss below 1.96
