Cotton stocks expected to decline
Global cotton production and stock estimates were revised downward for the end of 2016-17 by the International Cotton Advisory Committee. Production is still expected to rise year on year as global average yield is projected to improve but global cotton stocks are estimated to fall decline as cotton use exceeds production. Will cotton continue rising?
Cotton prices had been rising in recent weeks as production forecasts for India, world’s top cotton producer, were lowered due to drought because of late monsoon. The International Cotton Advisory Committee recently increased its forecast of global cotton prices in 2016-17 by 2 cents to 72 cents a pound because of lower global production. The ICAC revised downward its forecast for global cotton stocks by the end of 2016-17 by 200,000 tonnes to 20.4m tonnes as production estimate was lowered by 280,000 tonnes to 23.0m tonnes. Production is still expected to rise year on year as global average yield is projected to rise by 5%. However global cotton stocks are estimated to fall 5% year on year as cotton use exceeds production by 930,000 tonnes. US cotton production is expected to rise 14% year on year to 3.2m tones as US Department of Agriculture raised cotton sowings area, and India’s output is expected to rise 8% to 6.3m tonnes as monsoon weather improved. Pakistan cotton production is expected to not fall despite a drop in sowings area but Chinese output is forecast to fall 10% due to a drop in planted area.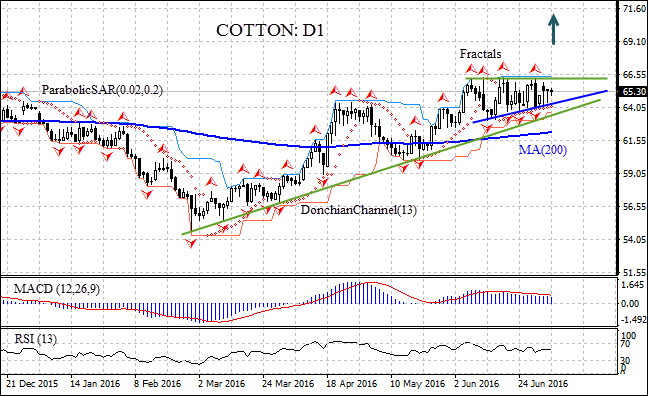
On the daily timeframe the Cotton: D1 has been rising since the end of February. The price is consolidating in a triangle chart pattern which formed in mid-June. It is above the 200-day moving average MA(200) and the support line of the uptrend. The Parabolic indicator gives a buy signal. The Donchian channel is tilted upward indicating uptrend. The RSI oscillator is neutral as it is flat and hasn’t reached the overbought zone. The MACD indicator is above the signal line, the gap with the signal line is narrowing and the signal line leveling off. This is a bearish signal. We believe the bullish momentum will resume after the price closes above the last fractal high and upper Donchian boundary at 66.41. A pending order to buy can be placed above that level. The stop loss can be placed below the last fractal low at 64.02. After placing the order, the stop loss is to be moved every day to the next fractal low, following Parabolic signals. Thus, we are changing the probable profit/loss ratio to the breakeven point. The most risk-averse traders may switch to the 4-hour chart after the trade and place there a stop-loss moving it in the direction of the trade. If the price meets the stop loss level (64.02) without reaching the order(66.41) , we recommend cancelling the position: the market sustains internal changes which were not taken into account.
PositionBuyBuy stopabove 66.41Stop lossbelow 64.02
- English (UK)
- English (India)
- English (Canada)
- English (Australia)
- English (South Africa)
- English (Philippines)
- English (Nigeria)
- Deutsch
- Español (España)
- Español (México)
- Français
- Italiano
- Nederlands
- Português (Portugal)
- Polski
- Português (Brasil)
- Русский
- Türkçe
- العربية
- Ελληνικά
- Svenska
- Suomi
- עברית
- 日本語
- 한국어
- 简体中文
- 繁體中文
- Bahasa Indonesia
- Bahasa Melayu
- ไทย
- Tiếng Việt
- हिंदी
Technical Analysis #C-COTTON : 2016-07-08
Published 07/08/2016, 10:07 AM
Updated 12/18/2019, 06:45 AM
Technical Analysis #C-COTTON : 2016-07-08

IFC Markets
3rd party Ad. Not an offer or recommendation by Investing.com. See disclosure here or
remove ads
.
Latest comments
Install Our App
Risk Disclosure: Trading in financial instruments and/or cryptocurrencies involves high risks including the risk of losing some, or all, of your investment amount, and may not be suitable for all investors. Prices of cryptocurrencies are extremely volatile and may be affected by external factors such as financial, regulatory or political events. Trading on margin increases the financial risks.
Before deciding to trade in financial instrument or cryptocurrencies you should be fully informed of the risks and costs associated with trading the financial markets, carefully consider your investment objectives, level of experience, and risk appetite, and seek professional advice where needed.
Fusion Media would like to remind you that the data contained in this website is not necessarily real-time nor accurate. The data and prices on the website are not necessarily provided by any market or exchange, but may be provided by market makers, and so prices may not be accurate and may differ from the actual price at any given market, meaning prices are indicative and not appropriate for trading purposes. Fusion Media and any provider of the data contained in this website will not accept liability for any loss or damage as a result of your trading, or your reliance on the information contained within this website.
It is prohibited to use, store, reproduce, display, modify, transmit or distribute the data contained in this website without the explicit prior written permission of Fusion Media and/or the data provider. All intellectual property rights are reserved by the providers and/or the exchange providing the data contained in this website.
Fusion Media may be compensated by the advertisers that appear on the website, based on your interaction with the advertisements or advertisers.
© 2007-2024 - Fusion Media Limited. All Rights Reserved.