Drought supports cotton
India’s plantings of cotton are at seven year low and dry weather conditions raise concerns about cotton crops in China, US and Egypt. Will cotton continue advancing on unfavorable weather outlook?
Cotton prices have been rising as exports from India fell sharply with local prices rallying due to tight supplies because of drought caused by slow progress of Indian monsoon. The Cotton Association of India (CAI) estimates the world's biggest producer will produce about 34.1 million bales of cotton in the 2015/16 season that started on October 1, down from last year's output of 38.3 million as Indian cotton planting has fallen to a seven year low of 11.0m hectares in 2016-17. In October to April cotton supplies in Indian spot markets fell 12.5% from a year ago. Lower plantings are expected also in Egypt and Egyptian farmers are expected to produce roughly 400 thousand bales. The weather has been unfavorable for cotton in China recently too, and hot and dry conditions in US cotton growing areas in South East, Midsouth and western Texas have raised concerns about US cotton crop as well. With lower cotton crops expected in India, the world’s top cotton grower and second biggest exporter, and threats to cotton crops in other major producer countries due to unfavorable growing conditions because of dry weather the outlook for cotton remains bullish.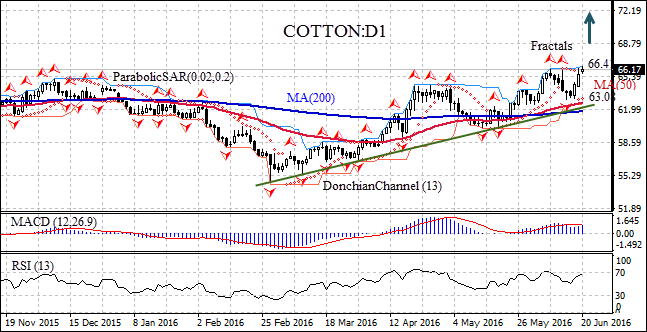
On the daily timeframe the Cotton: D1 has been trading upward since the end of February. The price is edging higher from the support line of the uptrend, with the 50-day moving average MA(50) crossing above the 200-day moving average MA(200) in the beginning of June. The Parabolic indicator has formed a buy signal. The Donchian channel is tilted upward indicating uptrend. The RSIoscillator is rising towards the overbought zone. The MACD indicator is above the signal line, the gap with the signal line is rising and the signal line leveling off. This is a bullish signal. We believe the closing above the last fractal high and upper Donchian boundary at 66.41 will signify the continuation of bullish momentum. A pending order to buy can be placed above that level. The stop loss can be placed below the fractal low at 63.08, confirmed also by the Parabolic signal. After placing the order, the stop loss is to be moved every day to the next fractal low, following Parabolic signals. Thus, we are changing the probable profit/loss ratio to the breakeven point. The most risk-averse traders may switch to the 4-hour chart after the trade and place there a stop-loss moving it in the direction of the trade. If the price meets the stop loss level at 63.08 without reaching the order, we recommend cancelling the position: the market sustains internal changes which were not taken into account.
PositionBuyBuy stopabove 66.41Stop lossbelow 63.08
- English (UK)
- English (India)
- English (Canada)
- English (Australia)
- English (South Africa)
- English (Philippines)
- English (Nigeria)
- Deutsch
- Español (España)
- Español (México)
- Français
- Italiano
- Nederlands
- Português (Portugal)
- Polski
- Português (Brasil)
- Русский
- Türkçe
- العربية
- Ελληνικά
- Svenska
- Suomi
- עברית
- 日本語
- 한국어
- 简体中文
- 繁體中文
- Bahasa Indonesia
- Bahasa Melayu
- ไทย
- Tiếng Việt
- हिंदी
Technical Analysis #C-COTTON : 2016-06-21
Published 06/21/2016, 09:37 AM
Updated 12/18/2019, 06:45 AM
Technical Analysis #C-COTTON : 2016-06-21

IFC Markets
3rd party Ad. Not an offer or recommendation by Investing.com. See disclosure here or
remove ads
.
Latest comments
Install Our App
Risk Disclosure: Trading in financial instruments and/or cryptocurrencies involves high risks including the risk of losing some, or all, of your investment amount, and may not be suitable for all investors. Prices of cryptocurrencies are extremely volatile and may be affected by external factors such as financial, regulatory or political events. Trading on margin increases the financial risks.
Before deciding to trade in financial instrument or cryptocurrencies you should be fully informed of the risks and costs associated with trading the financial markets, carefully consider your investment objectives, level of experience, and risk appetite, and seek professional advice where needed.
Fusion Media would like to remind you that the data contained in this website is not necessarily real-time nor accurate. The data and prices on the website are not necessarily provided by any market or exchange, but may be provided by market makers, and so prices may not be accurate and may differ from the actual price at any given market, meaning prices are indicative and not appropriate for trading purposes. Fusion Media and any provider of the data contained in this website will not accept liability for any loss or damage as a result of your trading, or your reliance on the information contained within this website.
It is prohibited to use, store, reproduce, display, modify, transmit or distribute the data contained in this website without the explicit prior written permission of Fusion Media and/or the data provider. All intellectual property rights are reserved by the providers and/or the exchange providing the data contained in this website.
Fusion Media may be compensated by the advertisers that appear on the website, based on your interaction with the advertisements or advertisers.
© 2007-2024 - Fusion Media Limited. All Rights Reserved.