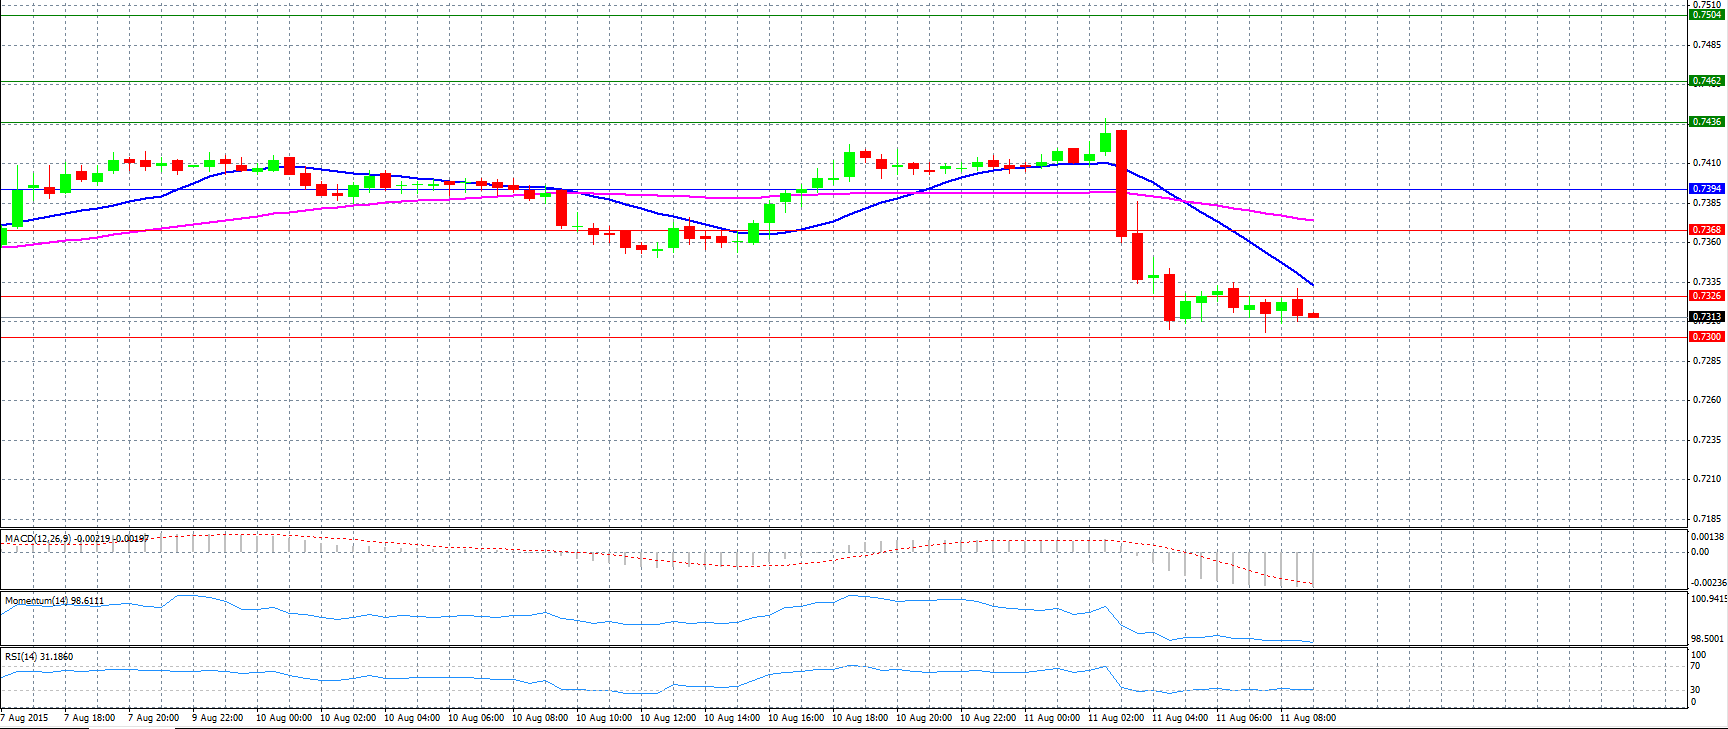
Market Scenario 1: Long positions above 0.7394 with targets at 0.7436 and 0.7462.
Market Scenario 2: Short positions below 0.7394 with targets at 0.7368 and 0.7326.
Comment: The pair dropped sharply and reached 1-week low after the release of Australian business confidence data.
Supports and Resistances:
R3 0.7504
R2 0.7462
R1 0.7436
PP 0.7394
S1 0.7368
S2 0.7326
S3 0.7300
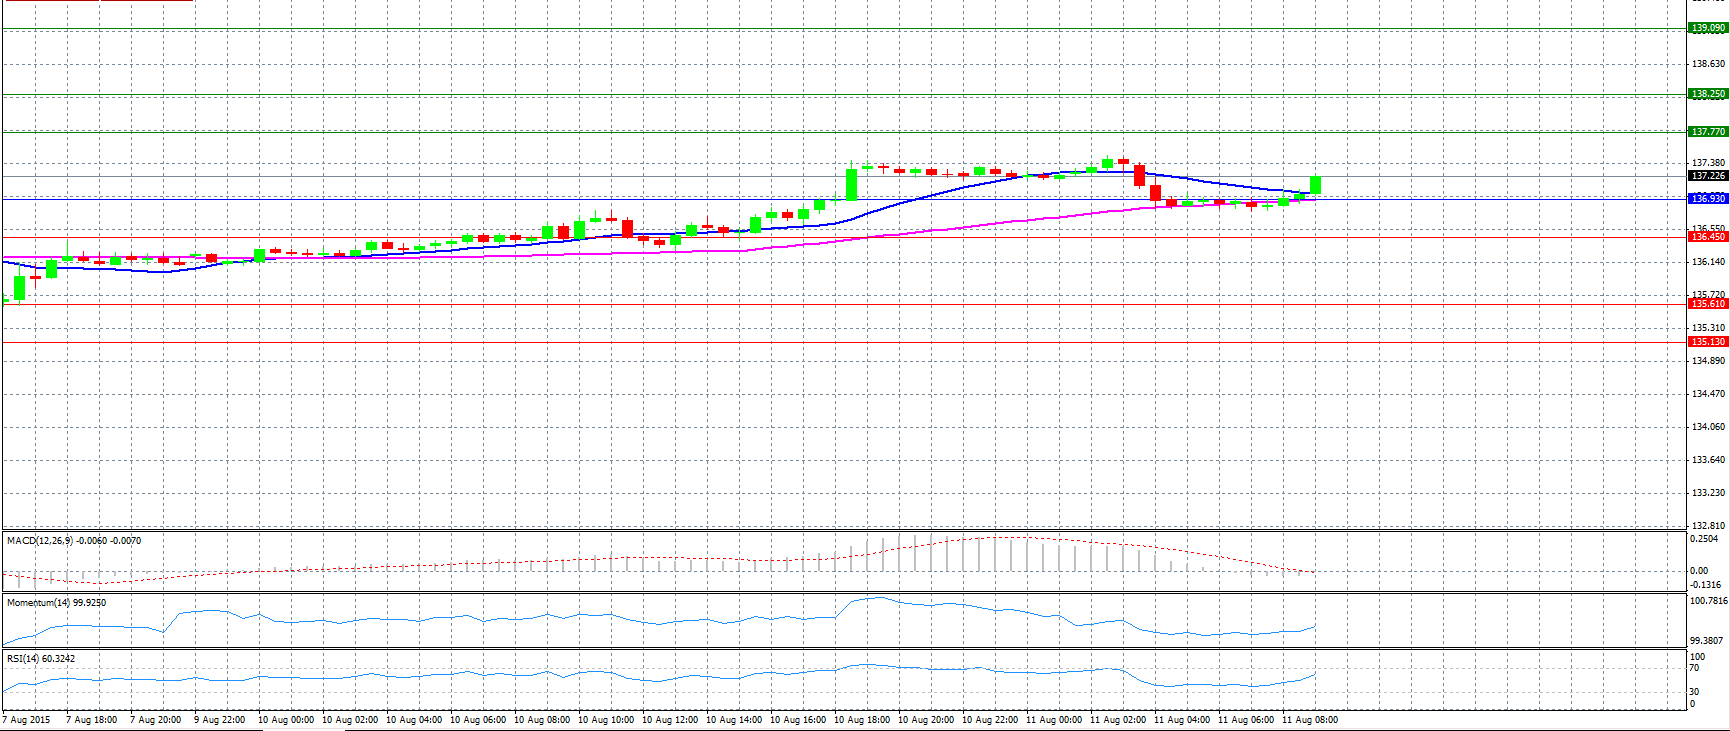
Market Scenario 1: Long positions above 136.93 with targets at 137.77 and 138.25.
Market Scenario 2: Short positions below 136.93 with targets at 136.45 and 135.61.
Comment: The pair tried to fall below the support level at pivot point 136.93, but rebounded above 137.00 level.
Supports and Resistances:
R3 139.09
R2 138.25
R1 137.77
PP 136.93
S1 136.45
S2 135.61
S3 135.13
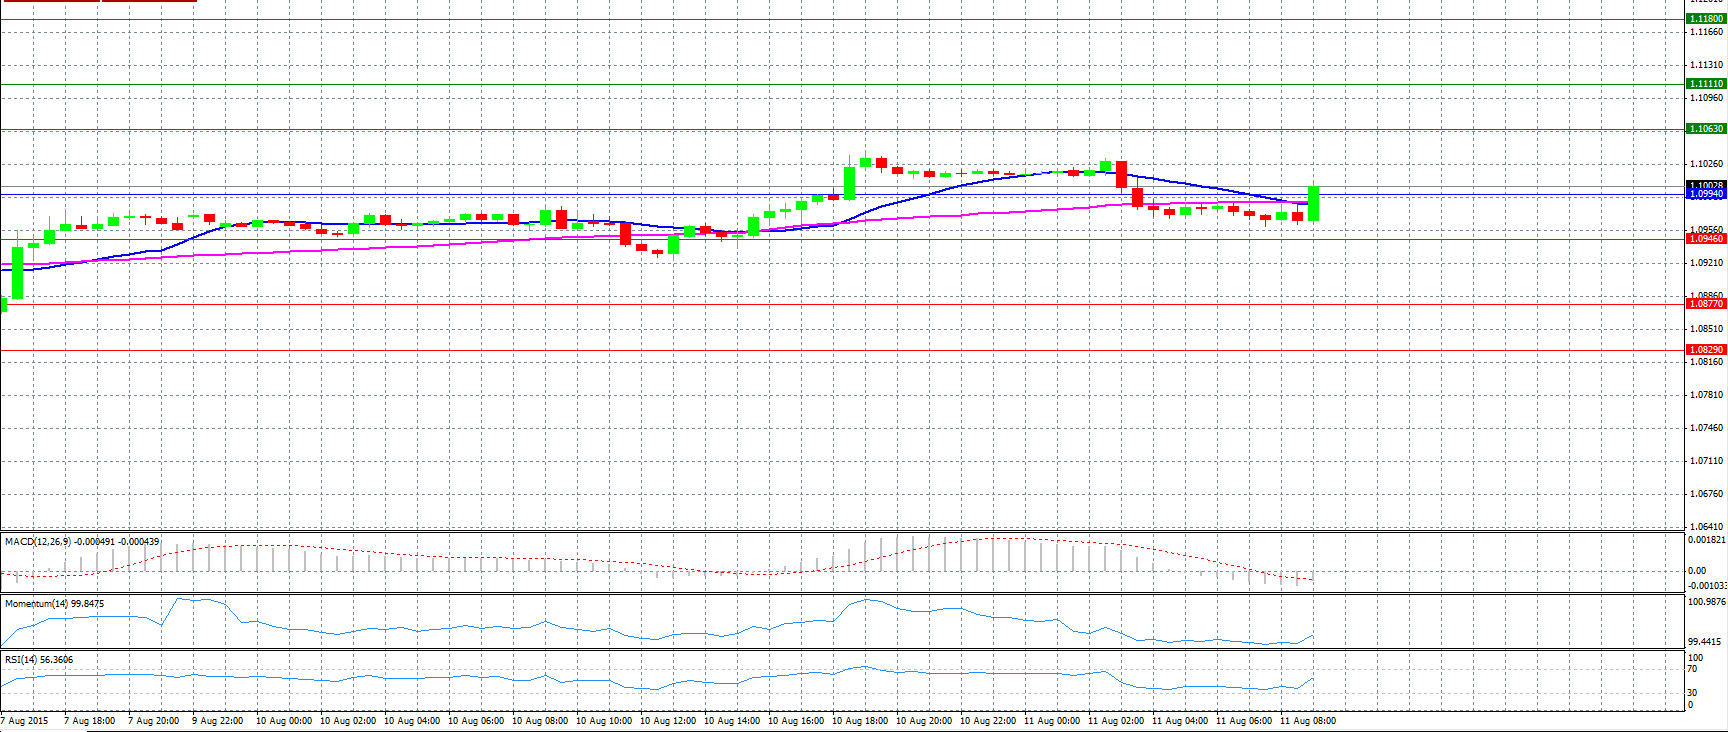
Market Scenario 1: Long positions above 1.0994 with targets at 1.1063 and 1.1111.
Market Scenario 2: Short positions below 1.0994 with targets at 1.0946 and 1.0877.
Comment: The pair advanced again and tries to stay above pivot point 1.0994.
Supports and Resistances:
R3 1.1180
R2 1.1111
R1 1.1063
PP 1.0994
S1 1.0946
S2 1.0877
S3 1.0829
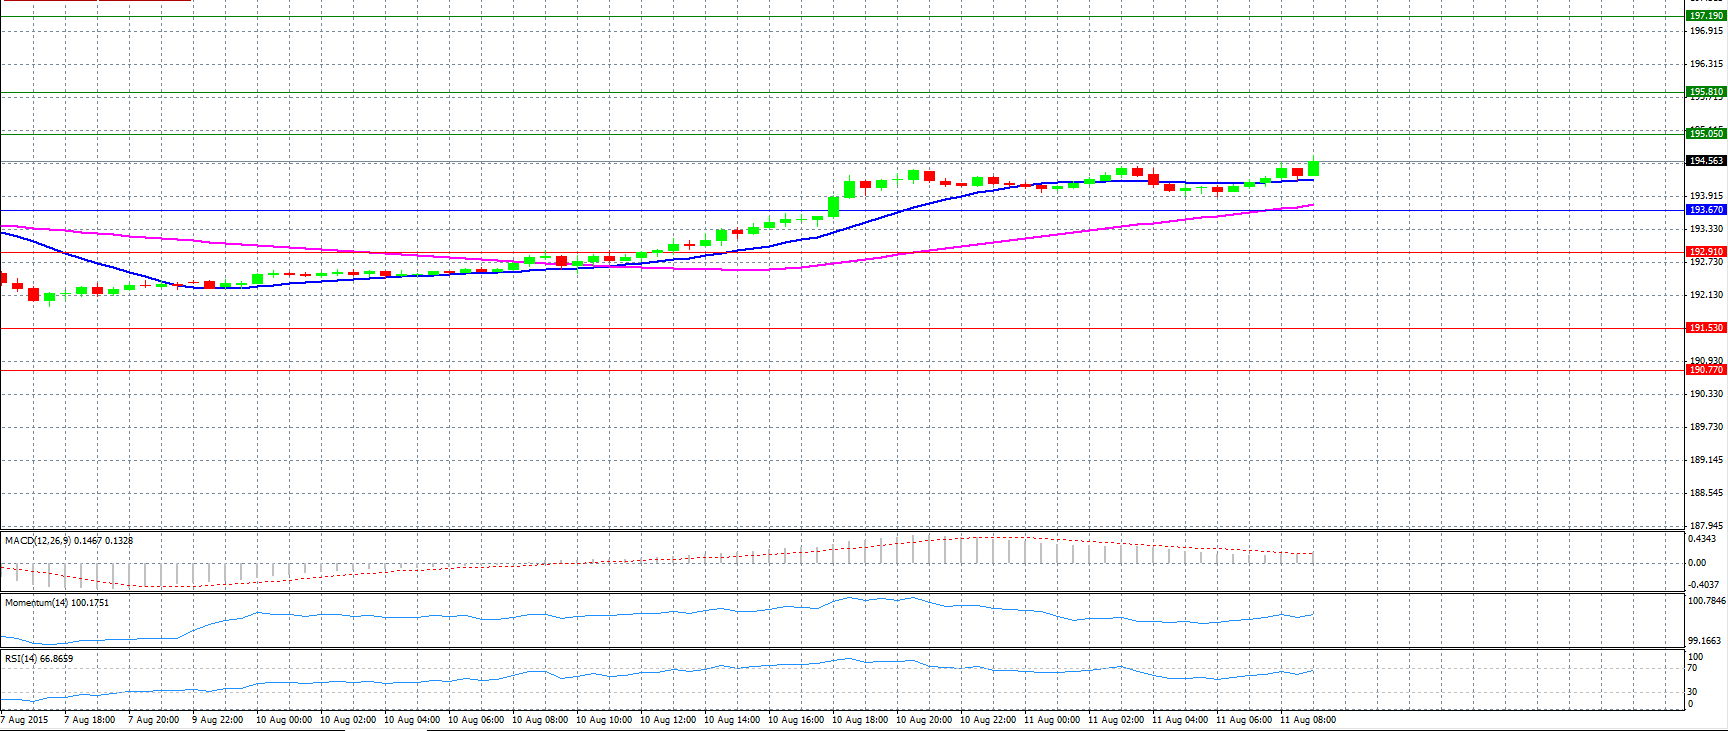
Market Scenario 1: Long positions above 193.67 with targets at 195.05 and 195.81.
Market Scenario 2: Short positions below 193.67 with targets at 192.91 and 191.53.
Comment: The pair has a bullish tone and trades above 194.50 level.
Supports and Resistances:
R3 197.19
R2 195.81
R1 195.05
PP 193.67
S1 192.91
S2 191.53
S3 190.77
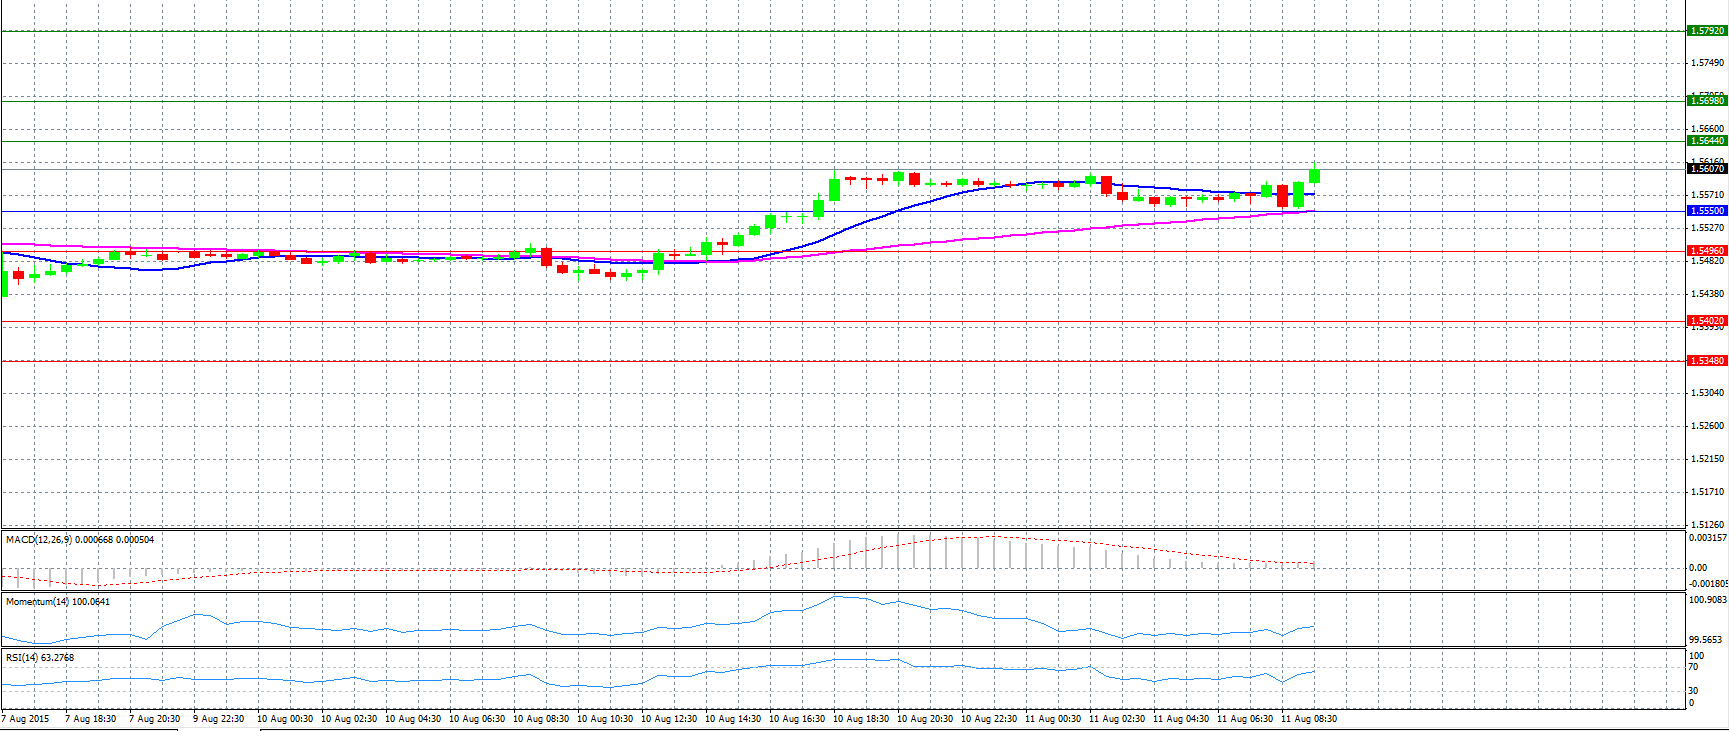
Market Scenario 1: Long positions above 1.5550 with targets at 1.5644 and 1.5698.
Market Scenario 2: Short positions below 1.5550 with targets at 1.5496 and 1.5402.
Comment: The pair rose and trades above 1.5600 level.
Supports and Resistances:
R3 1.5792
R2 1.5698
R1 1.5644
PP 1.5550
S1 1.5496
S2 1.5402
S3 1.5348
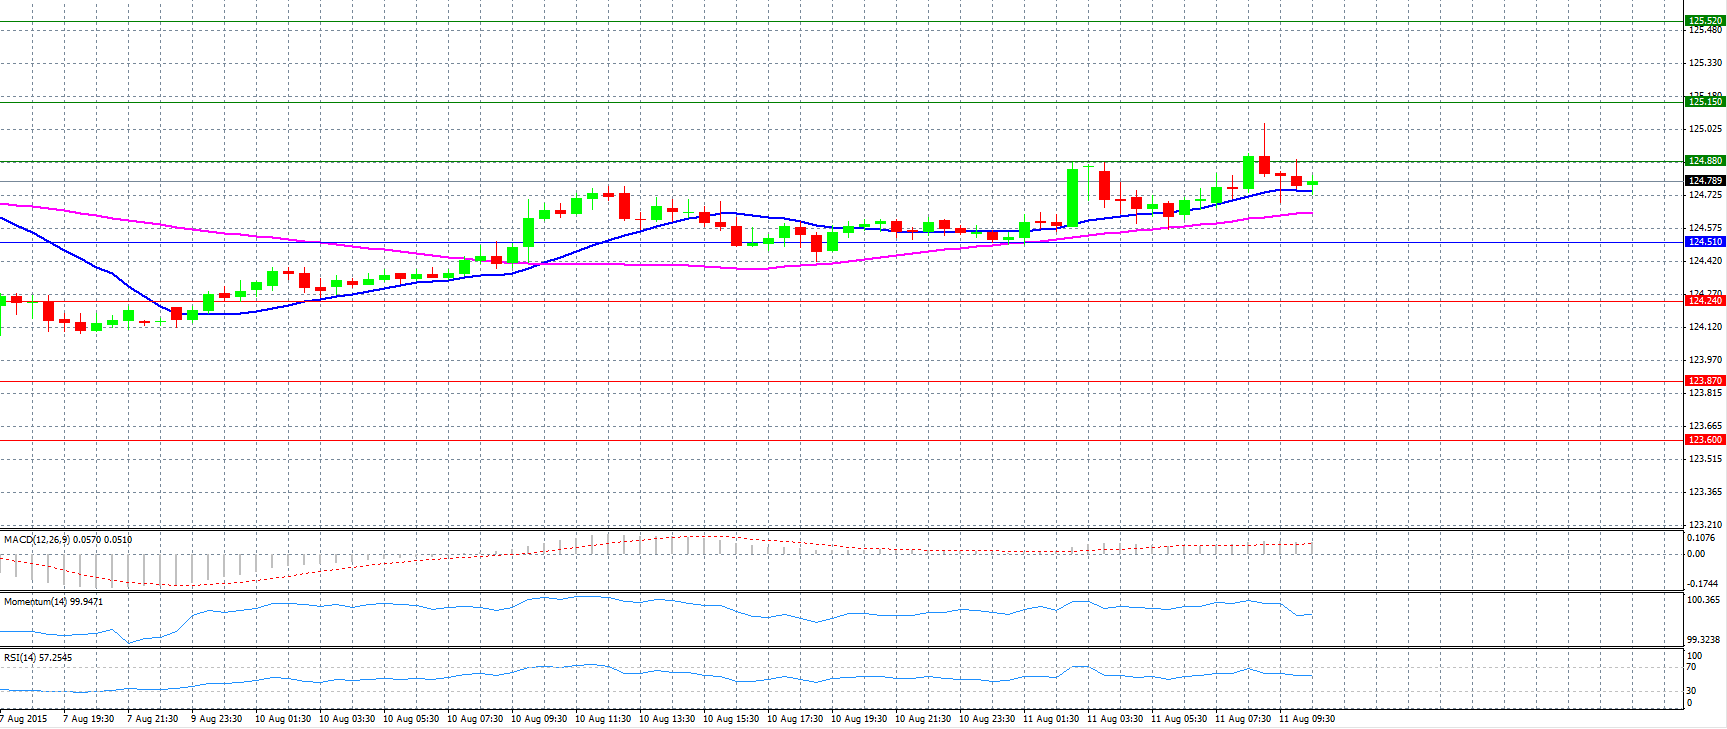
Market Scenario 1: Long positions above 124.51 with targets at 124.88 and 125.15.
Market Scenario 2: Short positions below 124.51 with targets at 124.24 and 123.87.
Comment: The pair aims for fresh two-month high.
Supports and Resistances:
R3 125.52
R2 125.15
R1 124.88
PP 124.51
S1 124.24
S2 123.87
S3 123.60
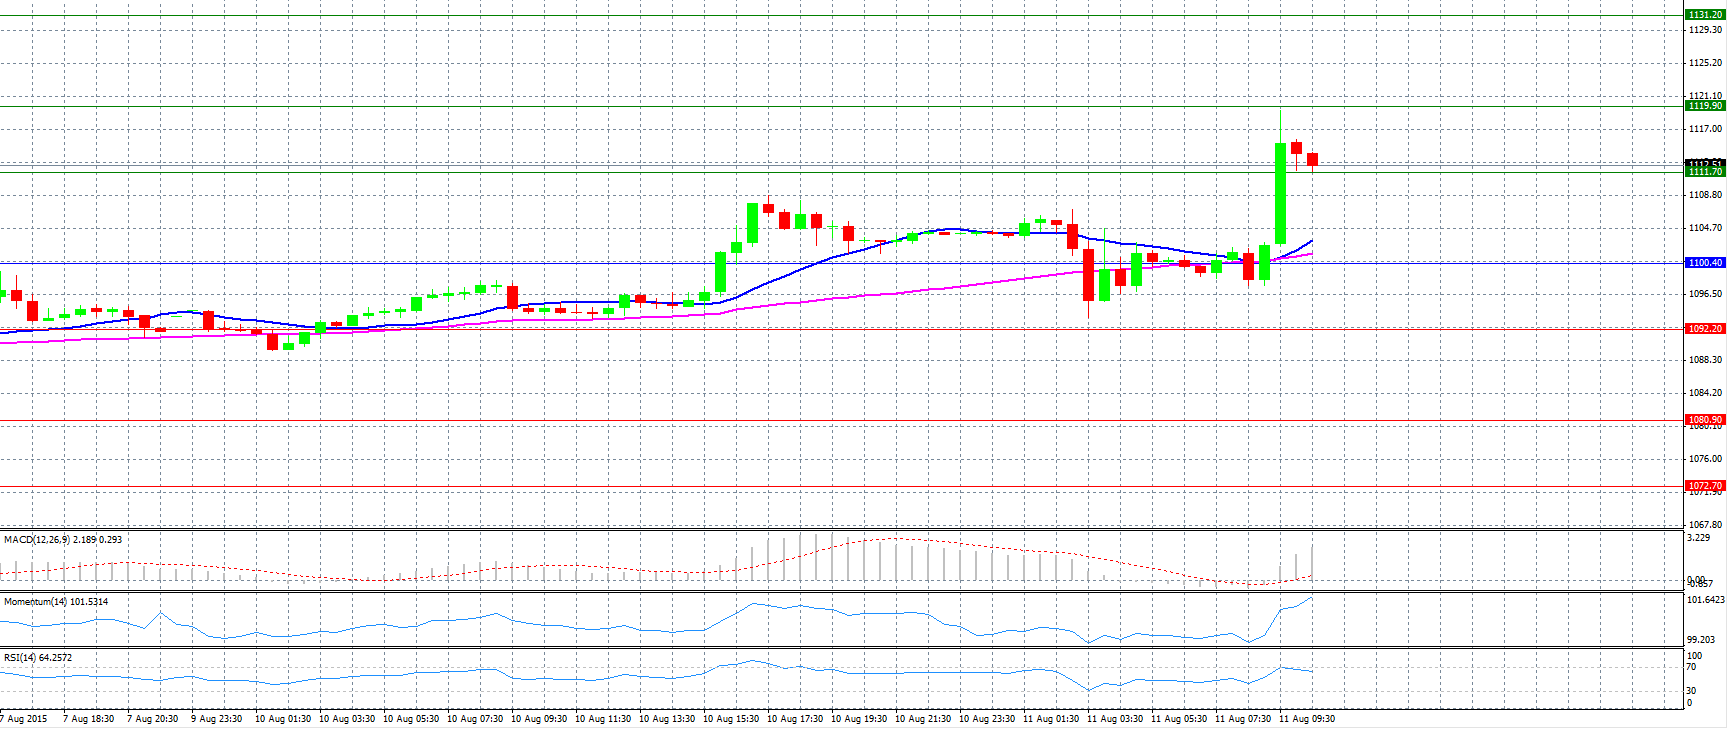
GOLD
Market Scenario 1: Long positions above 1100.40 with targets at 1111.70 and 1119.90.
Market Scenario 2: Short positions below 1100.40 with targets at 1092.20 and 1080.90.
Comment: Gold prices jumped above resistance level 1111.70.
Supports and Resistances:
R3 1131.20
R2 1119.90
R1 1111.70
PP 1100.40
S1 1092.20
S2 1080.90
S3 1072.70
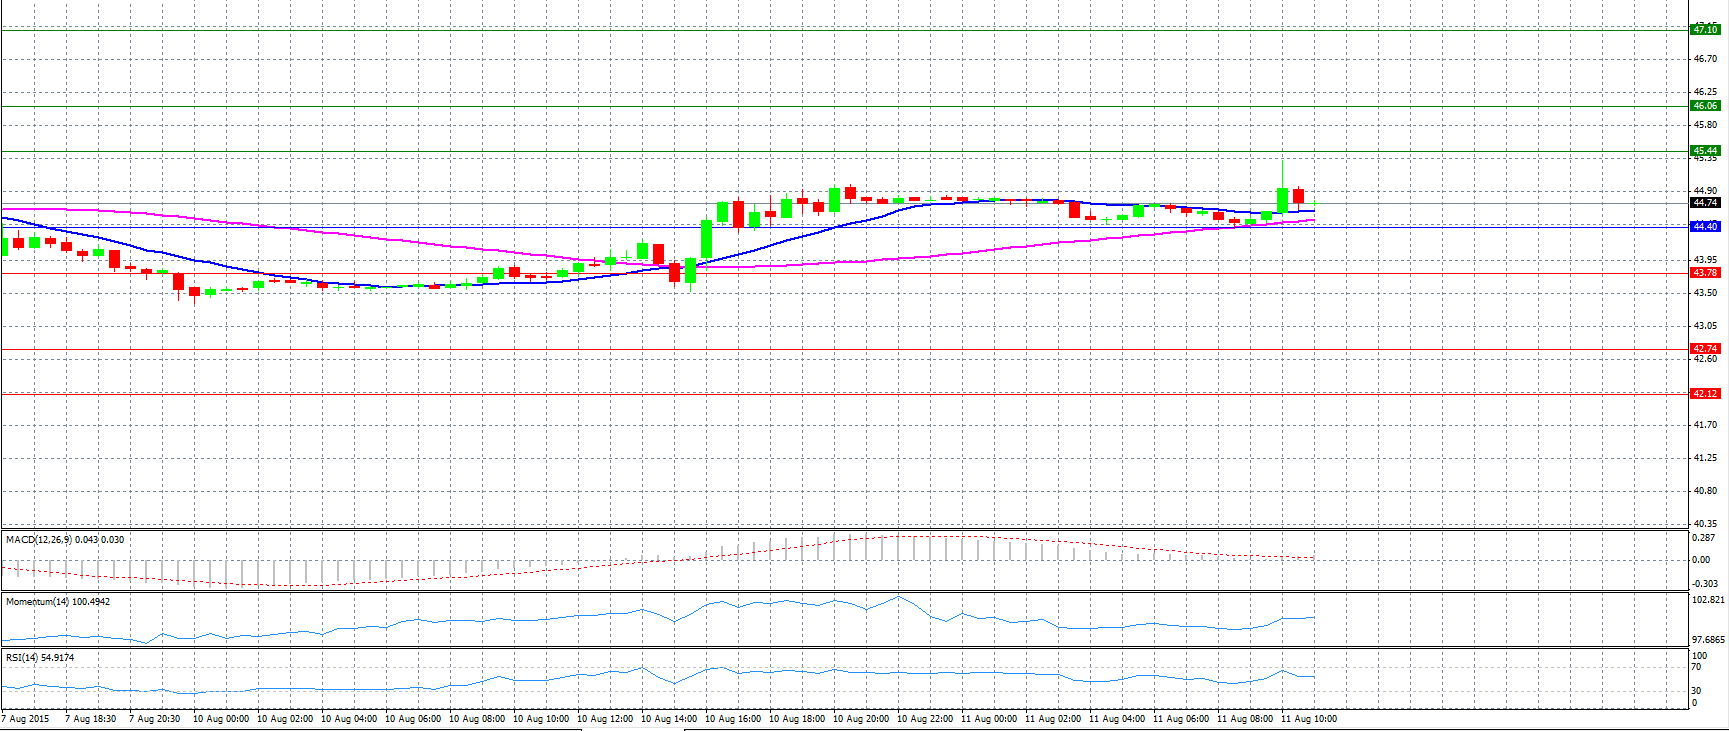
CRUDE OIL
Market Scenario 1: Long positions above 44.40 with targets at 45.44 and 46.06.
Market Scenario 2: Short positions below 44.40 with targets at 43.78 and 42.74.
Comment: Crude oil prices rose sharply near resistance level 45.44, but now returned to normal levels below 44.80.
Supports and Resistances:
R3 47.10
R2 46.06
R1 45.44
PP 44.40
S1 43.78
S2 42.74
S3 42.12
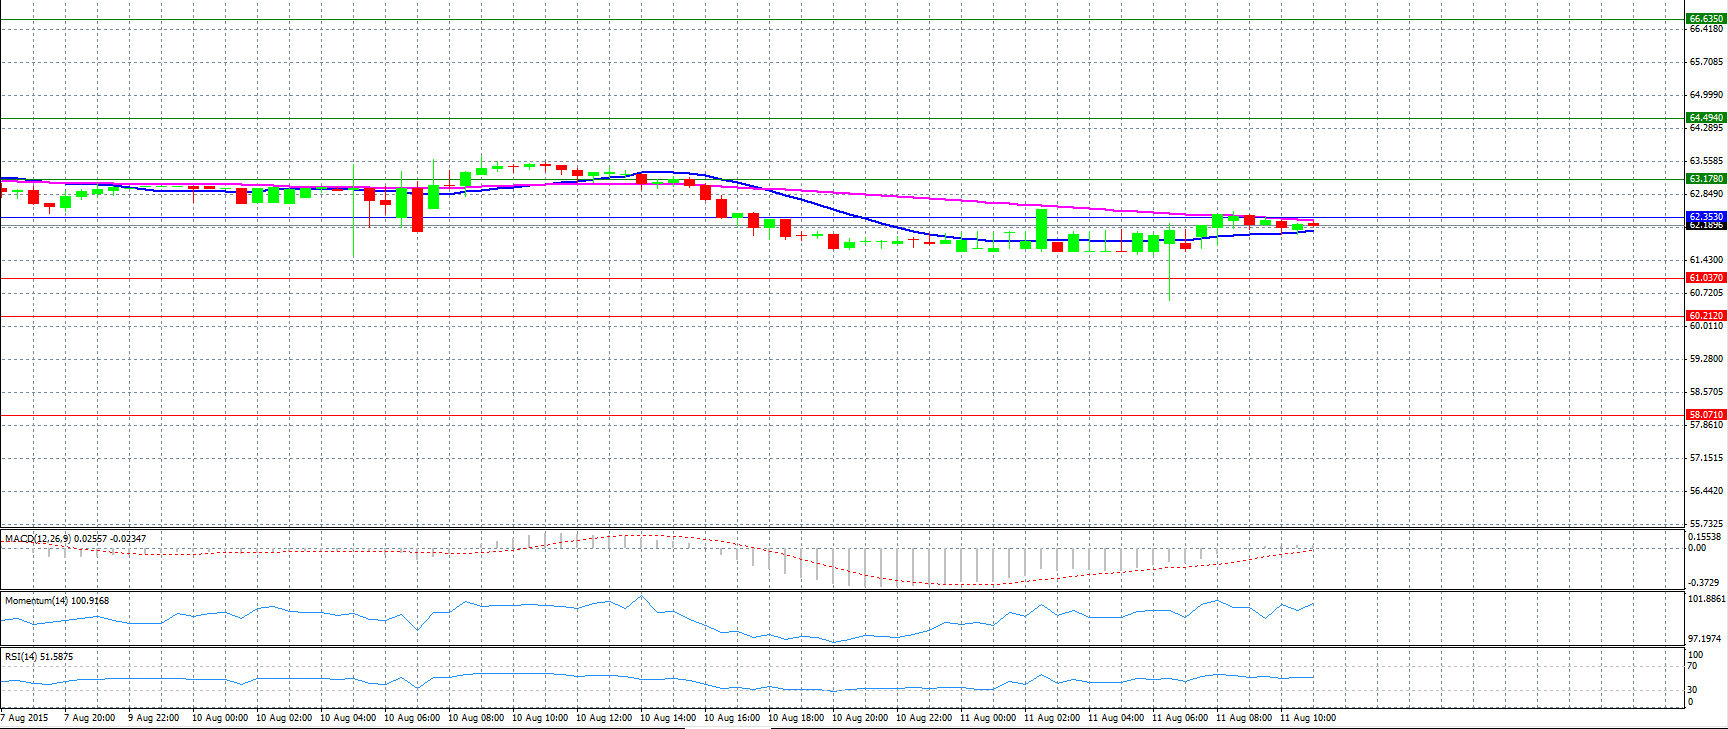
Market Scenario 1: Long positions above 62.353 with targets at 63.178 and 64.494.
Market Scenario 2: Short positions below 62.353 with targets at 61.037 and 60.212.
Comment: The pair trades neutral near pivot point 62.353.
Supports and Resistances:
R3 66.635
R2 64.494
R1 63.178
PP 62.353
S1 61.037
S2 60.212
S3 58.071
