🚀 AI-picked stocks soar in May. PRFT is +55%—in just 16 days! Don’t miss June’s top picks.Unlock full list

Ruble Depends Heavily On Global Oil Prices

Published 08/12/2015, 08:38 AM
Updated 12/18/2019, 06:45 AM
RUBFIX=RTS
-
LCO
-

Probable mean reversion

In this review we would like to present you the BRENT_RUB personal composite instrument (PCI) on the daily time frame. The instrument implies quoting Brent oil with the Russian ruble. In January-May 2015, fuel and energy commodities accounted for 65% of Russian export. That is why the ruble exchange value depends heavily on global oil prices. On the chart, it looks like the PCI intermittently reverses to the 200-day Moving Average. At the beginning of the year, Russia launched the so-called “tax maneuver.” It involves simultaneous cutting import fees (in order to make them consistent with Eurasian Economic Union) and raising mineral extraction taxes. We believe it may support Russian oil prices, expressed in rubles.
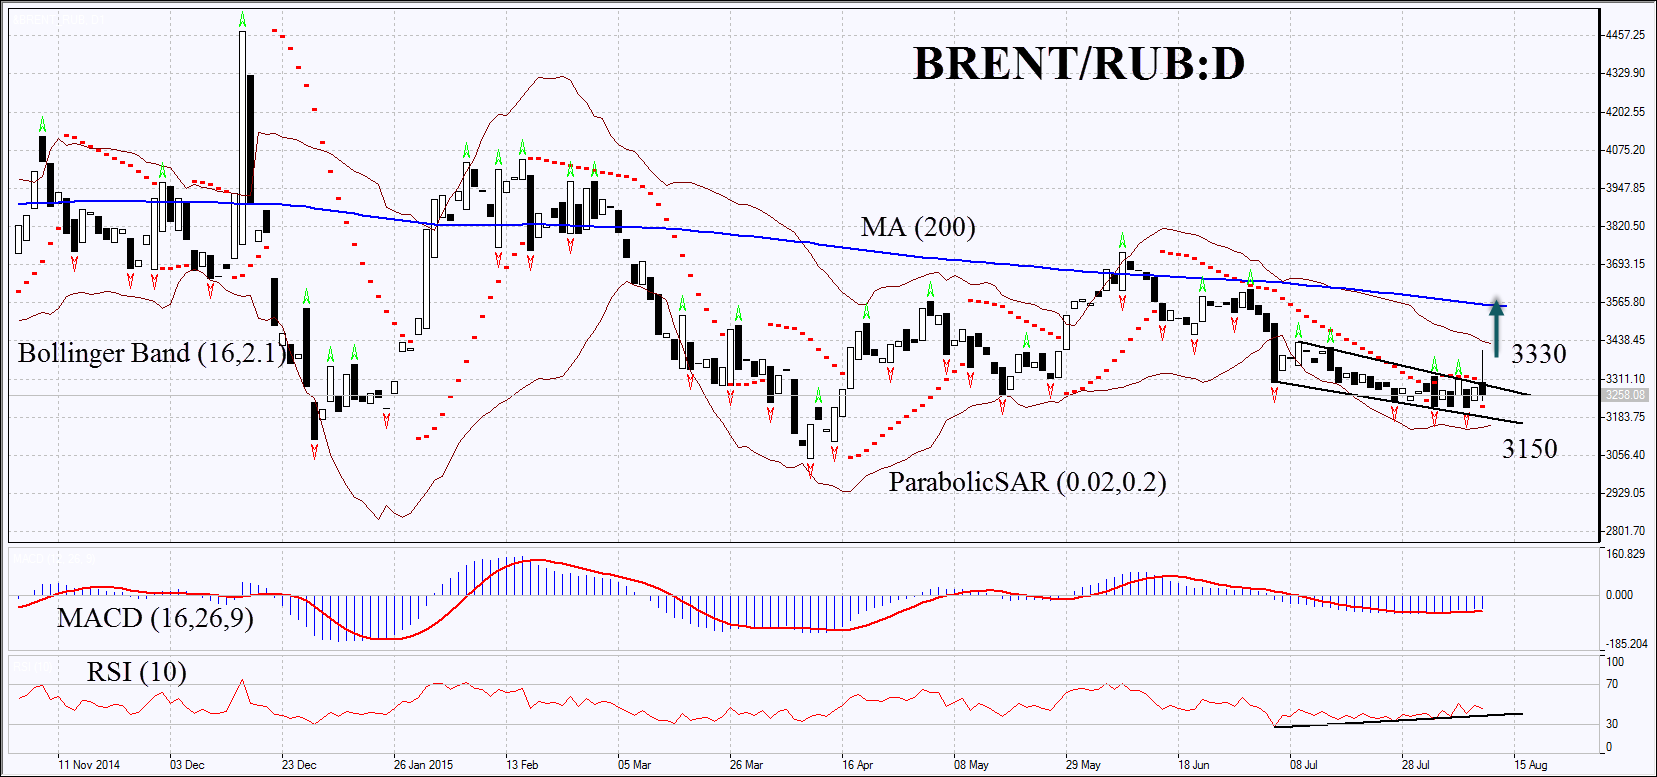
Brent/Ruble Daily Chart

On the daily chart, the BRENT_RUB PCI has been trying to cross up the downtrend. MACD and Parabolic have shaped bullish signals. Bollinger bands® have narrowed, indicating low volatility; the lower Bollinger line has been trying to reverse up. RSI-Bars has formed a bullish divergence but has not yet reached 50. A bullish momentum may develop if the price closes above two latest fractal highs and the Parabolic signals at 3330. A stop loss may be placed below three latest fractal lows, the Parabolic signal and the Bollinger band at 3150. After pending order activation, the stop loss is supposed to be moved every day to the next fractal low, following Parabolic and Bollinger signals. Thus, we are changing the probable profit/loss ratio to the breakeven point. The most cautious traders are recommended to switch to the H4 time frame and place a stop loss there, moving it after the trend. If the price reaches the stop loss without triggering the order, we recommend to cancel the position: the market sustains internal changes that were not considered.

Position Buy Buy stop above 3330 Stop loss below 3150

Latest comments

Loading next article…
Risk Disclosure: Trading in financial instruments and/or cryptocurrencies involves high risks including the risk of losing some, or all, of your investment amount, and may not be suitable for all investors. Prices of cryptocurrencies are extremely volatile and may be affected by external factors such as financial, regulatory or political events. Trading on margin increases the financial risks.
Before deciding to trade in financial instrument or cryptocurrencies you should be fully informed of the risks and costs associated with trading the financial markets, carefully consider your investment objectives, level of experience, and risk appetite, and seek professional advice where needed.
Fusion Media would like to remind you that the data contained in this website is not necessarily real-time nor accurate. The data and prices on the website are not necessarily provided by any market or exchange, but may be provided by market makers, and so prices may not be accurate and may differ from the actual price at any given market, meaning prices are indicative and not appropriate for trading purposes. Fusion Media and any provider of the data contained in this website will not accept liability for any loss or damage as a result of your trading, or your reliance on the information contained within this website.
It is prohibited to use, store, reproduce, display, modify, transmit or distribute the data contained in this website without the explicit prior written permission of Fusion Media and/or the data provider. All intellectual property rights are reserved by the providers and/or the exchange providing the data contained in this website.
Fusion Media may be compensated by the advertisers that appear on the website, based on your interaction with the advertisements or advertisers.
© 2007-2024 - Fusion Media Limited. All Rights Reserved.