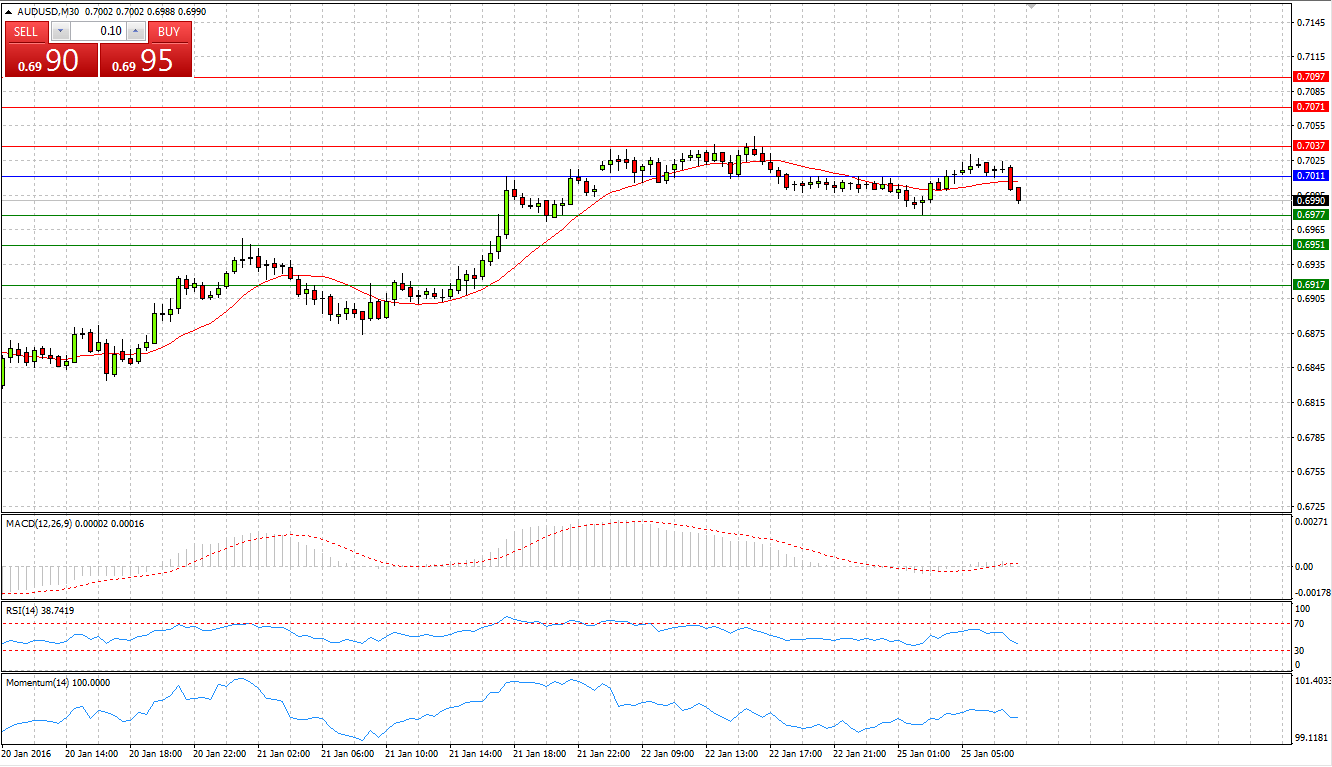
Market Scenario 1: Long positions above 0.7011 with targets at 0.7037 and 0.7071
Market Scenario 2: Short positions below 0.7011 with targets at 0.6977 and 0.6951
Comment: Aussie during Friday’s session came under selling pressure and closed the day in the negative territory against US dollar, first negative day in 6 trading sessions. Today the pair continues trading under pressure below Pivot Point level.
Supports and Resistances:
R3 0.7097
R2 0.7071
R1 0.7037
PP 0.7011
S1 0.6977
S2 0.6951
S3 0.6917
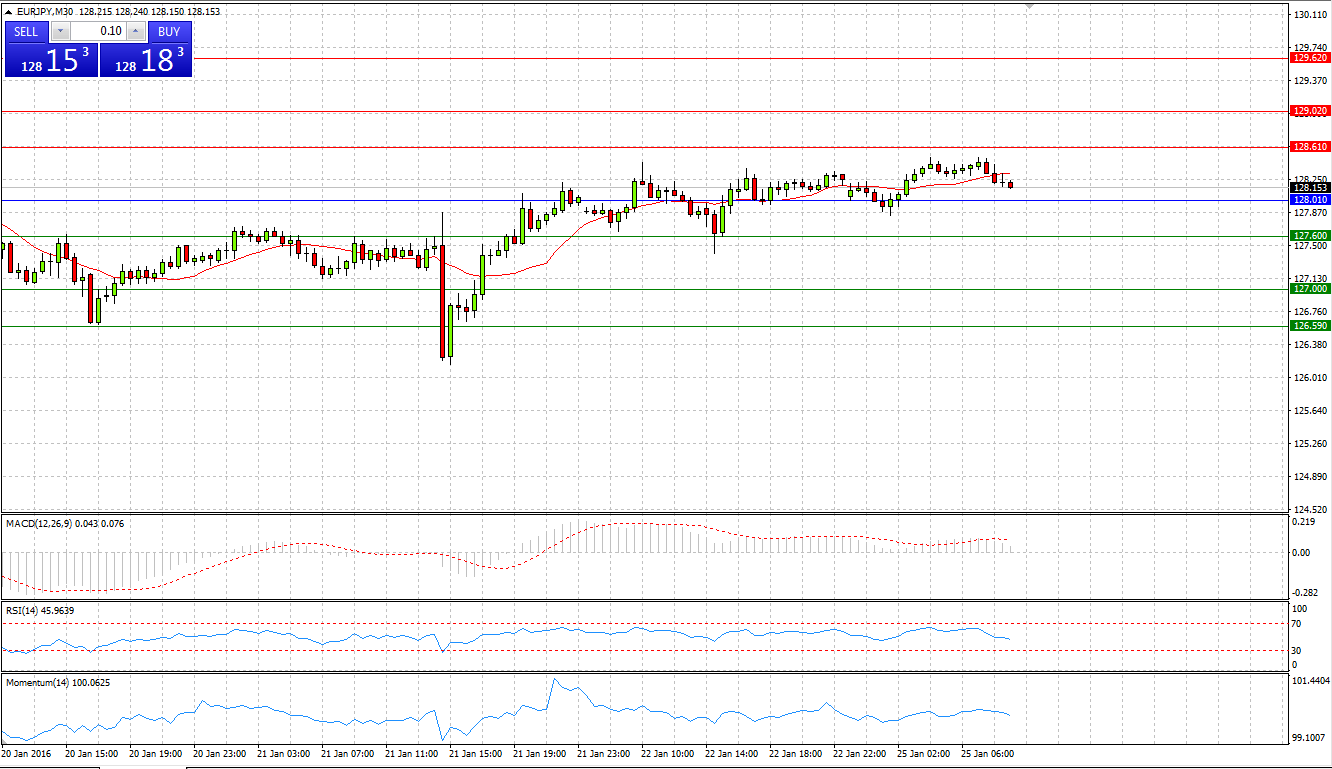
Market Scenario 1: Long positions above 128.01 with targets at 128.61 and 129.02
Market Scenario 2: Short positions below 128.01 with targets at 127.60 and 127.00
Comment: European currency during Friday’s session closed the second day in a row in positive territory against Japanese yen at 128.24. Today the pair is trading flat slightly above Pivot Point level.
Supports and Resistances:
R3 129.62
R2 129.02
R1 128.61
PP 128.01
S1 127.60
S2 127.00
S3 126.59
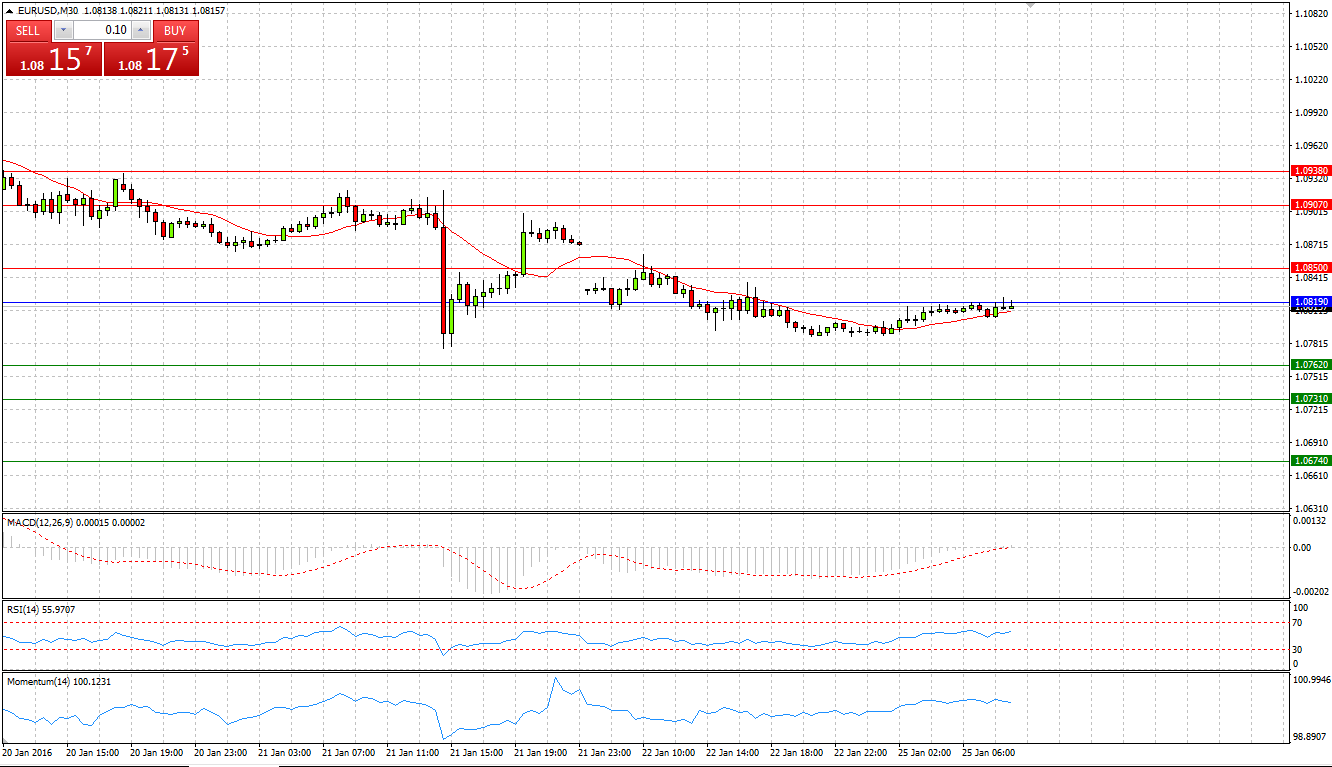
Market Scenario 1: Long positions above 1.0819 with targets at 1.0850 and 1.0907
Market Scenario 2: Short positions below 1.0819 with targets at 1.0762 and 1.0731
Comment: European currency during Friday’s session came under selling pressure and closed the day below 1.08 US dollars per euro. Today the pair is trading with positive bias, however, below Pivot Point level.
Supports and Resistances:
R3 1.0938
R2 1.0907
R1 1.0850
PP 1.0819
S1 1.0762
S2 1.0731
S3 1.0674
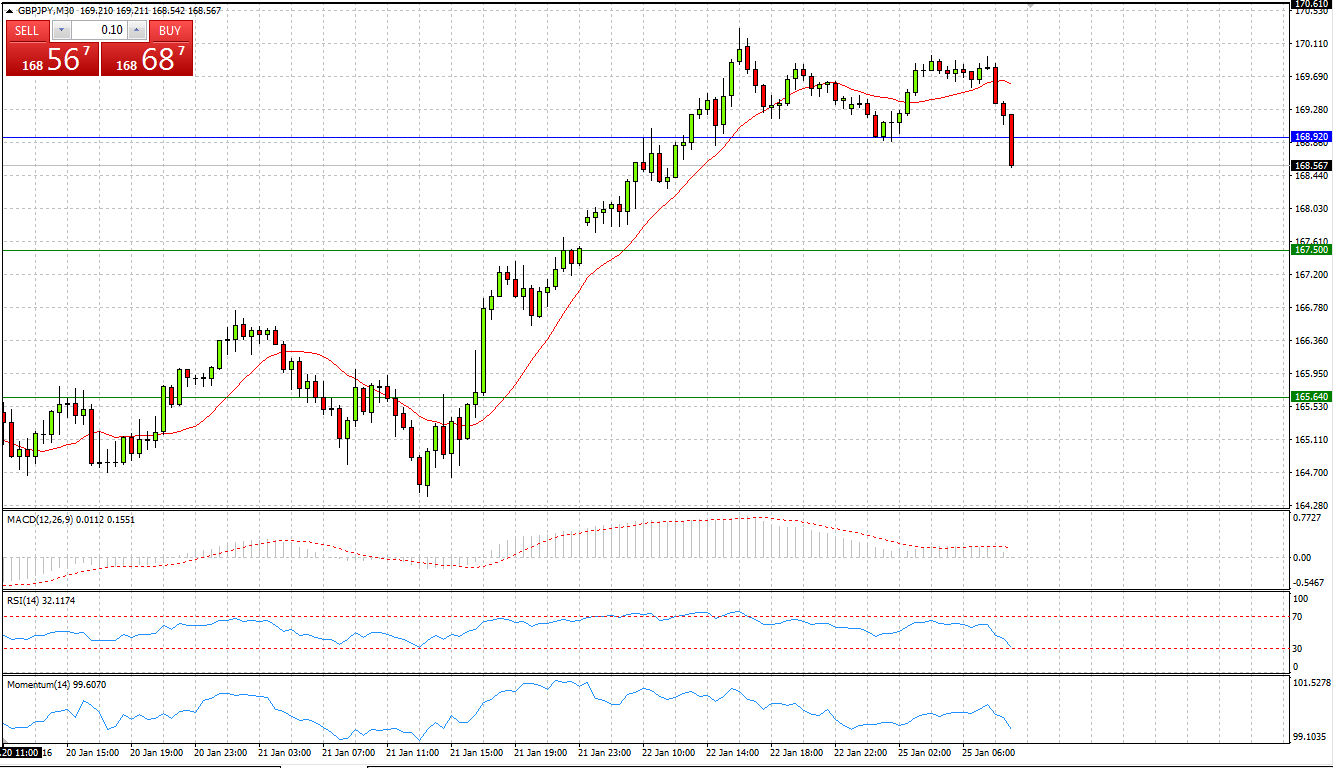
Market Scenario 1: Long positions above 168.92 with targets at 170.78 and 172.20
Market Scenario 2: Short positions below 168.92 with targets at 167.50 and 165.64
Comment: Sterling during Friday’s session managed to close the second day in a row on the positive side against Japanese yen, gaining as much as 350 pips profit per two days. Today the pair is trading slightly under pressure below Pivot Point level.
Supports and Resistances:
R3 174.06
R2 172.20
R1 170.78
PP 168.92
S1 167.50
S2 165.64
S3 164.22
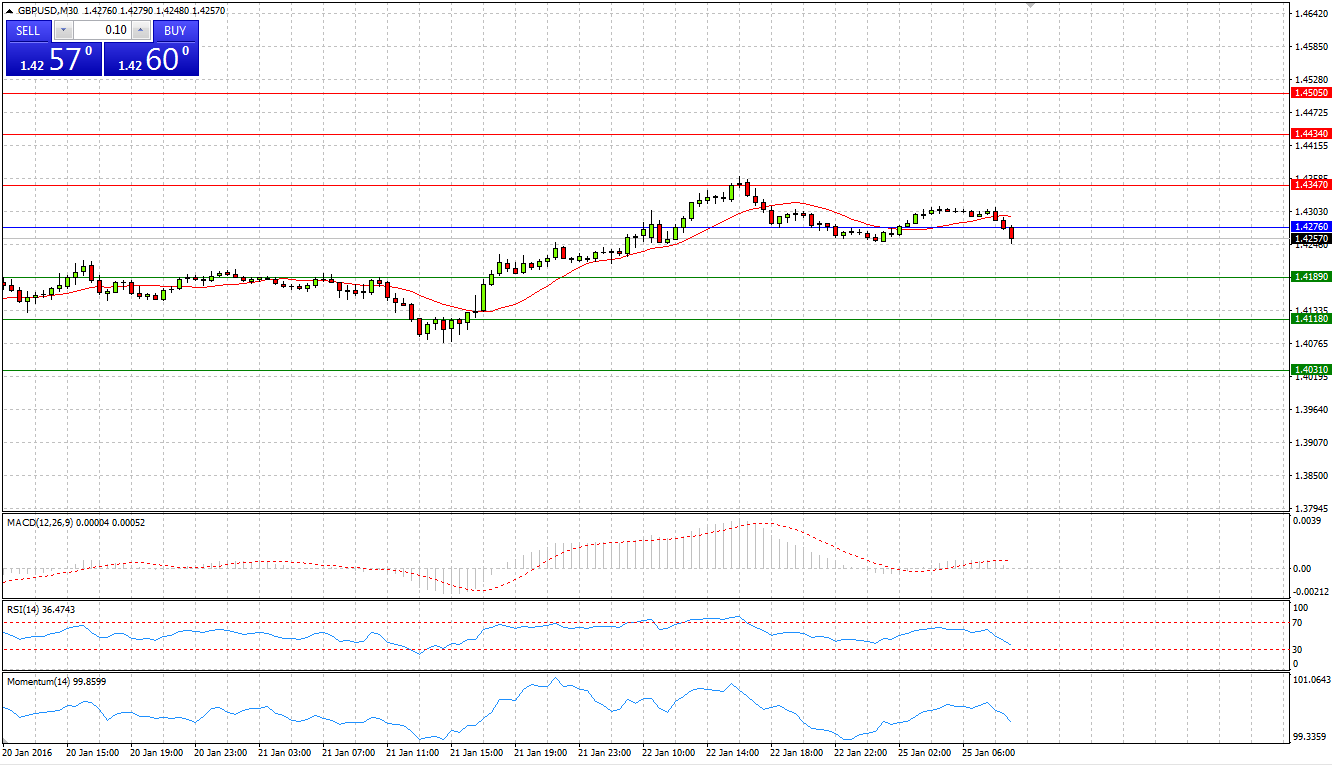
Market Scenario 1: Long positions above 1.4276 with targets at 1.4347 and 1.4434
Market Scenario 2: Short positions below 1.4276 with targets at 1.4189 and 1.4118
Comment: Sterling during Friday’s session undertook an attempt to break through the First resistance level at 1.4347 against US dollar, however, being unable to break it retreated closing the session below Pivot Point level. Today the pair is trading flat slightly below Pivot point level.
Supports and Resistances:
R3 1.4505
R2 1.4434
R1 1.4347
PP 1.4276
S1 1.4189
S2 1.4118
S3 1.4031
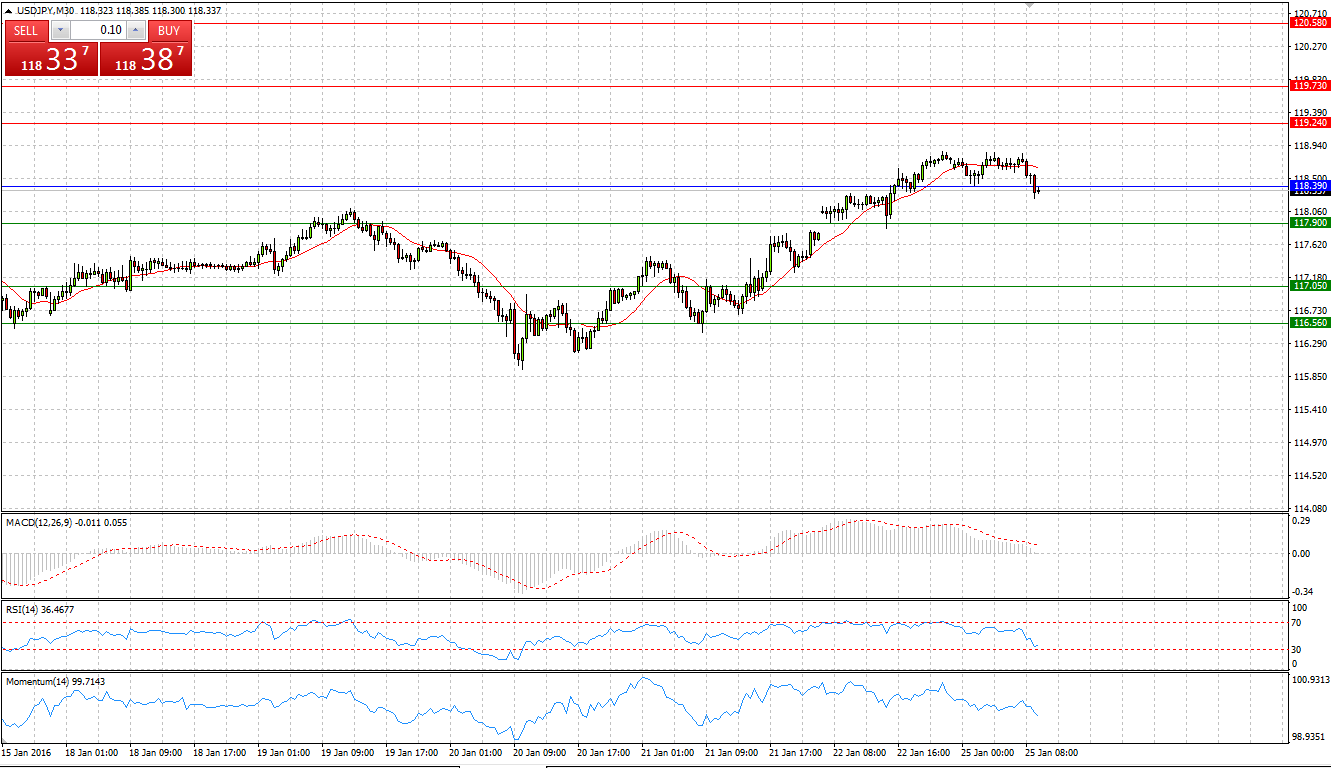
Market Scenario 1: Long positions above 118.39 with targets at 119.24 and 119.73
Market Scenario 2: Short positions below 118.39 with targets at 117.90 and 117.05
Comment:US dollar during Friday’s session closed the second day in a row on positive territory against Japanese yen, regaining as much as 200 pips per 2 days. Today the pair is trading slightly under pressure close to the Pivot Point level.
Supports and Resistances:
R3 120.58
R2 119.73
R1 119.24
PP 118.39
S1 117.90
S2 117.05
S3 116.56
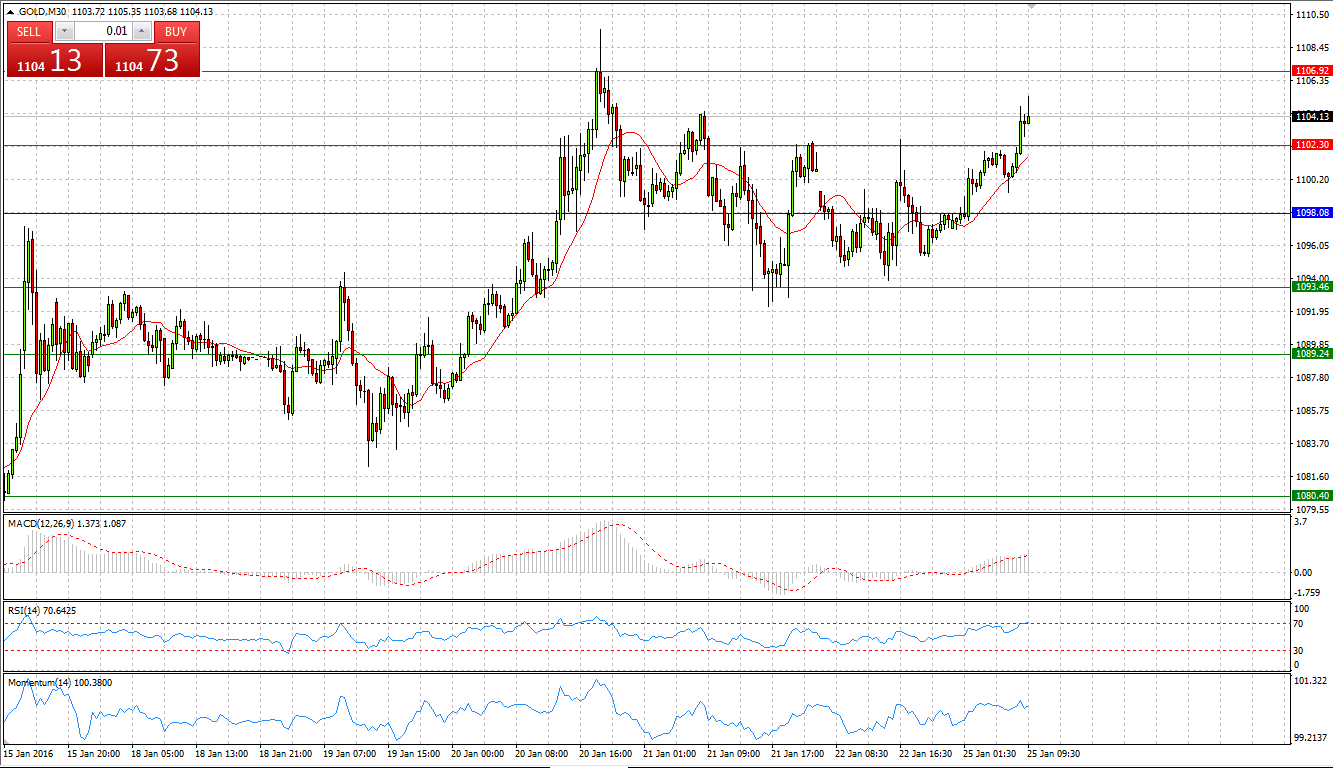
Market Scenario 1: Long positions above 1098.08 with targets at 1102.30 and 1106.92
Market Scenario 2: Short positions below 1098.08 with targets at 1093.46 and 1089.24
Comment: Gold during Friday’s session was trading flat, closing the day almost unchanged against US dollar. Today bullion is trading firm, having already broken through the first resistance level and aiming to test the second one.
Supports and Resistances:
R3 1115.76
R2 1106.92
R1 1102.30
PP 1098.08
S1 1093.46
S2 1089.24
S3 1080.40
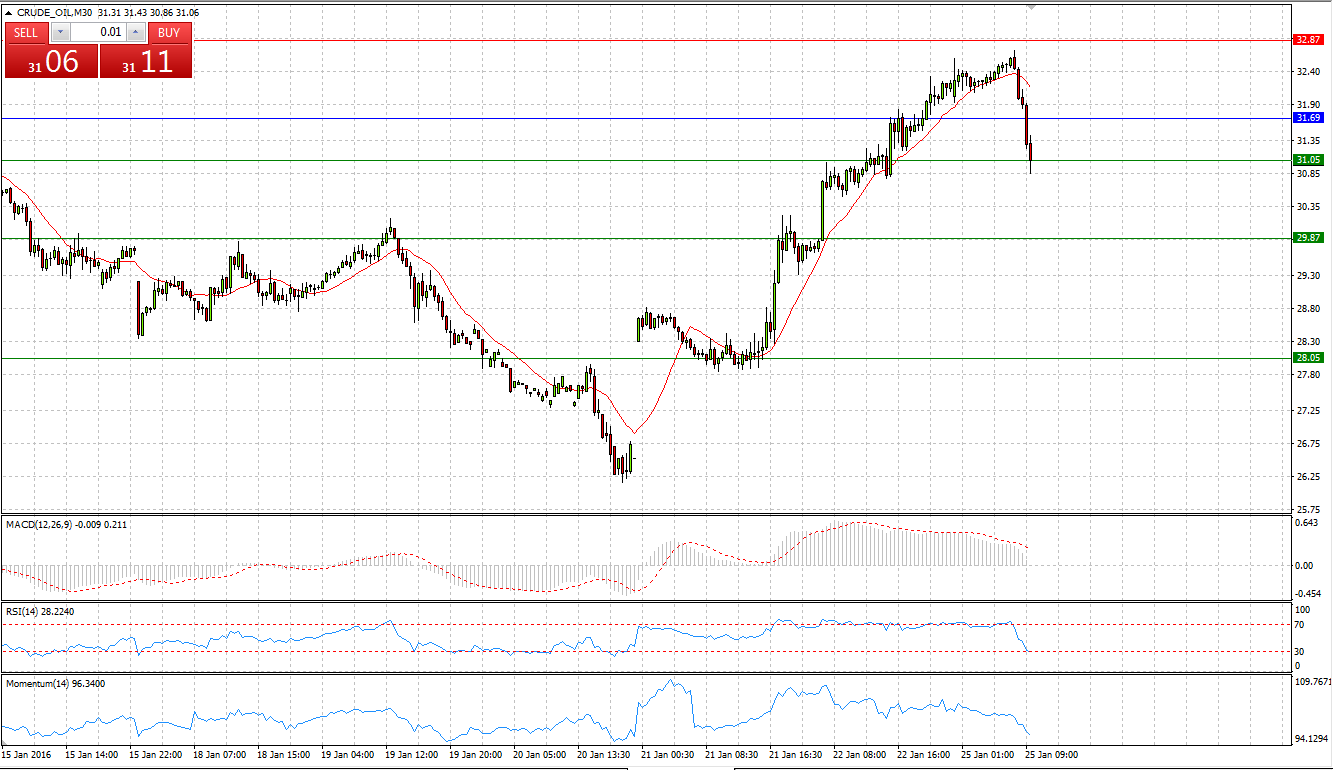
Market Scenario 1: Long positions above 31.69 with targets at 32.87 and 33.51
Market Scenario 2: Short positions below 31.69 with targets at 31.05 and 29.87
Comment: Crude during yesterday’s session rose for the second day in a row closing the session at 32.33, the highest level since January 11th. Today crude oil came under pressure and was sent below Pivot Point level aiming to break the First support level.
Supports and Resistances:
R3 35.33
R2 33.51
R1 32.87
PP 31.69
S1 31.05
S2 29.87
S3 28.05
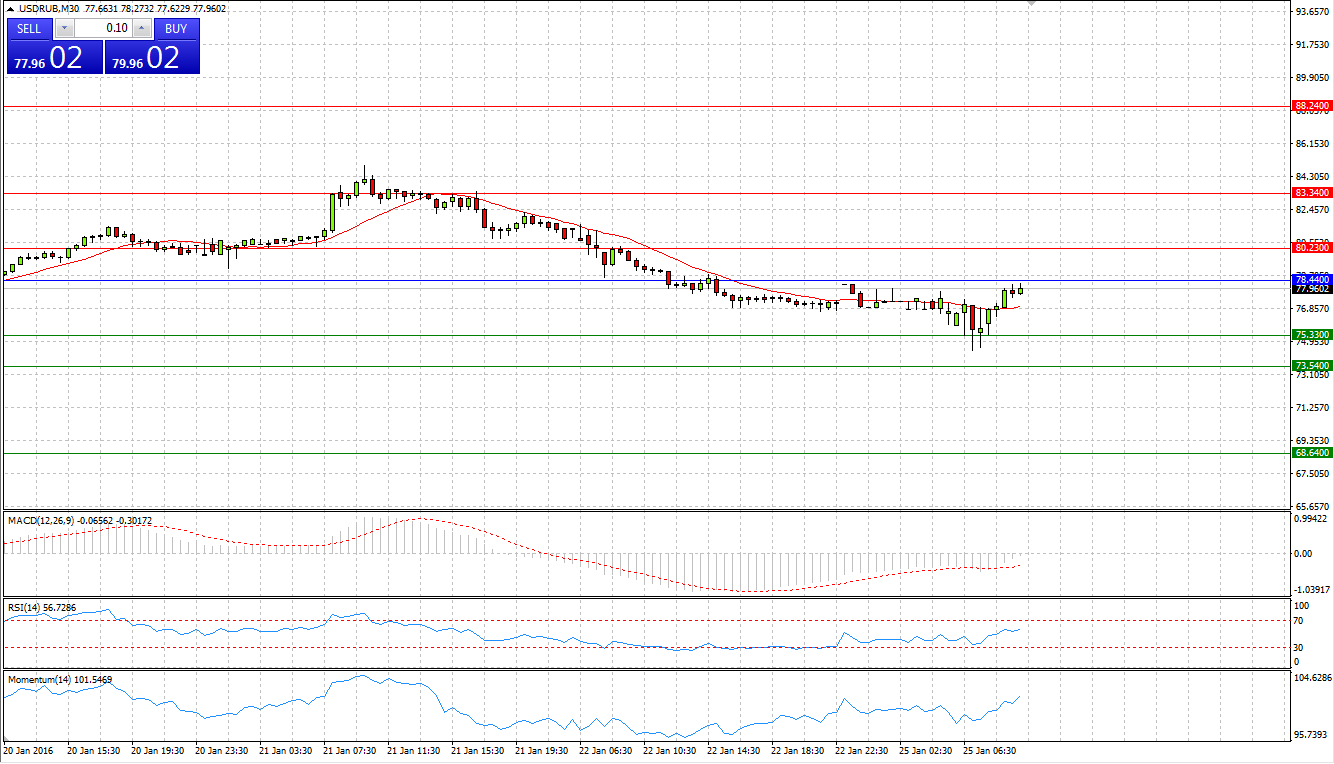
Market Scenario 1: Long positions above 78.44 with targets at 80.23 and 83.34
Market Scenario 2: Short positions below 78.44 with targets at 75.33 and 73.54
Comment: US dollar was drastically sold off against Russian ruble during Friday’s session amid increase in oil prices. However, today crude oil is trading not so firmly as the previous two trading sessions, and Russian ruble is gradually giving back positions gained in the last two trading sessions.
Supports and Resistances:
R3 88.24
R2 83.34
R1 80.23
PP 78.44
S1 75.33
S2 73.54
S3 68.64
