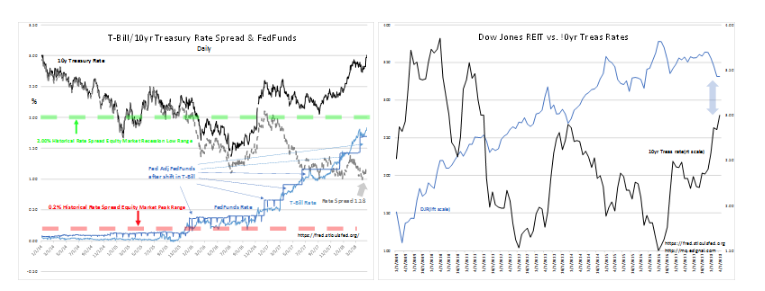
The discussion today is much about the 10yr Treas rate breaching above 3%. Higher rates can have an impact on asset prices when compared to Cash Flow Yields as shown in the Dow Jones REIT (DJR) vs 10yr Treasury Rates chart. Higher rates lower asset prices. REITs have been over-priced, by my analysis, for several years as global investors sought the US as a safe haven from the rise of autocrats, ISIS and terrorism. Even so, history indicates that as long as the T-Bill/10yr Treas rate spread remains wider than 0.2% (20bps-basis points), then financial institutions keep lending and economic activity keeps expanding. Recent market pessimism contracted this spread to 1.01%, the past 4days has witnessed this spread widening to 1.18%.
The Fed Reserve remains behind its historical position of keeping FFunds higher than T-Bill rates. FFunds rate is, at the moment, ~0.15%(~15bps) lower than T-Bill rates. Investors should expect a 0.25%-0.50% FFund rate increase. Market rates are already factored into economics and a rise in FFunds will have no economic impact even though most investors believe it to be so.

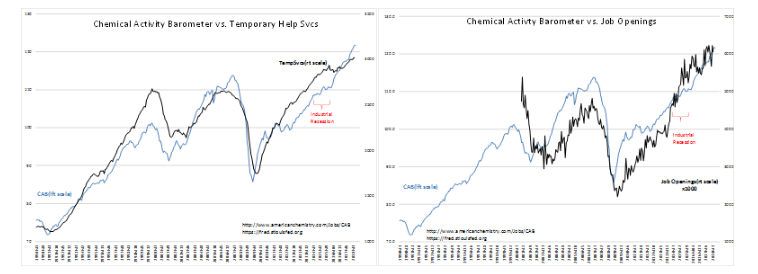
The Chemical Activity Barometer (CAB) and Temporary Help Svcs Indices are both higher and remain in decent uptrends. They are forecasting 12mos+ of continued economic expansion. The CAB and Job Opening Indices provide a similar forecast.

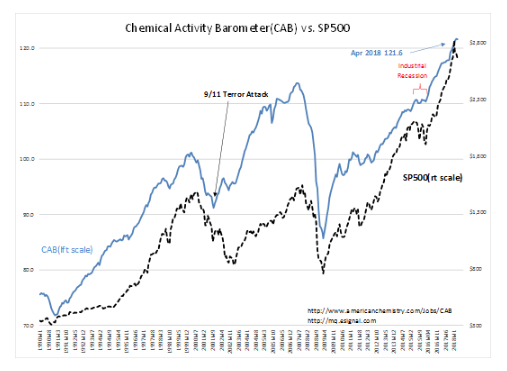
The correlation between CAB and SP500 indicates that the CAB leads and the SP500 follows. Market prices are reflections of market psychology and have always lagged economic activity. Most investors tend to be Momentum Investors whose investment perception is driven by headlines. A good example of this is today’s Caterpillar (NYSE:CAT) earnings report: “Caterpillar Just Gave a Huge Vote of Confidence to the Global Economy”.
Global economic indicators have been in strong uptrend since April 2016 and CAT has been releasing a rolling 3mo sales figure right along. This report was not a surprise. Just a surprise to those who invest with headlines which are after-the-fact.
So much for “Efficient Markets”!

The Investment Thesis:
While the markets worry about rising rates, economic trends continue to signal 12mos+ of economic expansion. What may prove a major surprise, are the policy changes currently in process. The new tax law, the recent reduction in government regulations, the potential loosening of Dodd-Frank lending restrictions and the potential for reduction in threats to global Democracies could very well result in extending the current economic upcycle another 5yrs.
As long as the T-Bill/10yr Treasury rate spread continues to be favorable, equity markets globally are likely to rise.
The information in this blog post represents my own opinions and does not contain a recommendation for any particular security or investment. I or my affiliates may hold positions or other interests in securities mentioned in the Blog, please see my Disclaimer page for my full disclaimer.