
Covered call writing is a short-term strategy where we sell Weekly or Monthly options to generate cash flow. It is best to use this strategy in sheltered accounts to defer or eliminate tax consequences but that is not always possible.
Generally, the income from covered call writing results in short-term capital gains (losses) but there are exceptions to this rule. This article will review a few scenarios regarding long and short-term capital gains relating to long-term holdings (stocks and exchange-traded funds held more than 1 year and 1 day). Let me premise my remarks by stating that I am not a tax expert and the information is based on discussions I’ve had with CPAs who developed the Schedule D of the Elite version of the Ellman calculator (available in the Blue Collar store and free to premium members). Please check with your tax advisor before taking any tax-related actions in your brokerage accounts.
A 1-month option is sold against a long-term holding and is bought back or expires worthless
The information is entered in the blue cells of Code D3 of the Elite version of the Ellman Calculator:
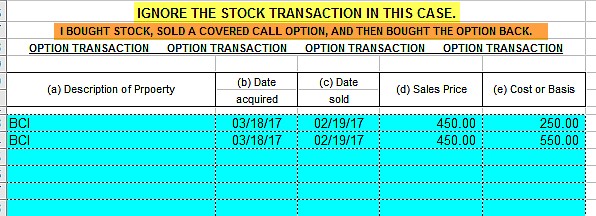
Sell Option/Buy Back Option
The options are sold for $450.00 per contract on 2/19/17. This is the sale date. Notice that the acquisition dates (3/18/17) are later than the sale dates. If the options expired worthless, the acquisition date would be the expiration date and the cost basis would be $0.00. In the top row, the option is bought back for $250.00 (resulting in a credit) and in the second row for $550.00 (resulting in a debit). Once the blue cells are populated, the white cells on the right side of the spreadsheet will become populated:
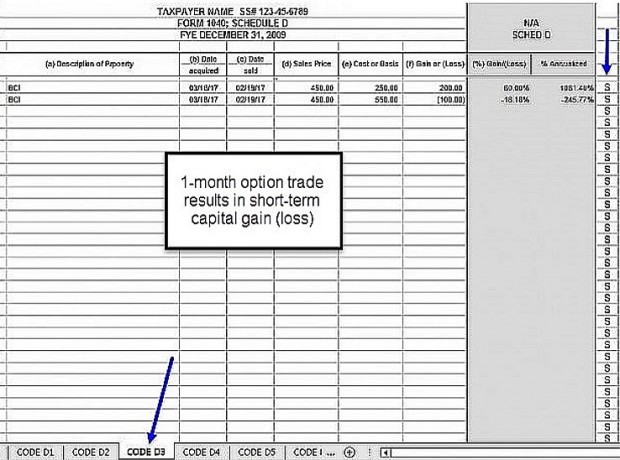
Code D3: Selling and Buying Back an Option
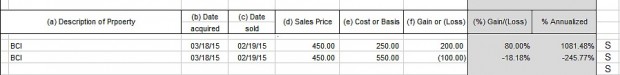
Code D3: Close-up View
Notice that the column to the far right (top blue arrow) shows “S” representing short-term capital gains (losses). These returns are stated as dollar amounts, percentiles and annualized percentiles.
A 1-month option is sold against a long-term holding and is exercised resulting in sale of the shares (short-term holding also shown)
The information is entered in the blue cells of Code D2 of the Elite version of the Ellman Calculator:

Code D2: Option Exercised on a Long-Term Holding
The top row reflects shares purchased on 3/18/15 for $45.00 per share representing a long-term holding. The second row reflects shares purchased on 12/19/16 for $69.50 per share resulting in a classification of a short-term holding. Both options were sold on 12/19/16 and were exercised on 1/20/17. Once the blue cells are populated, the white cells on the right side of the spreadsheet will show the calculations:
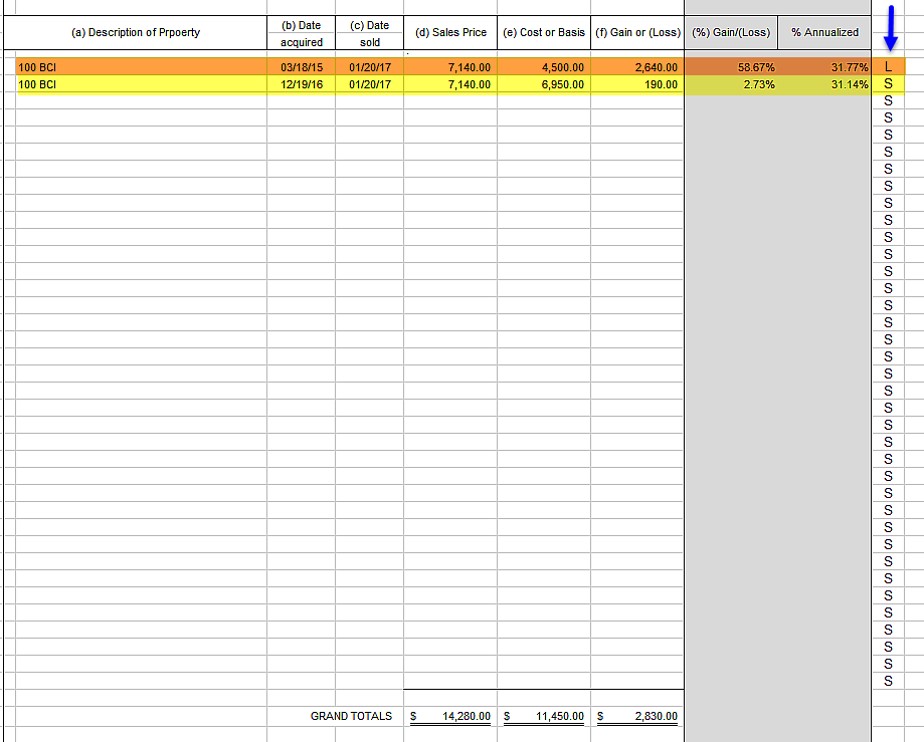
Option Exercise of Short and Long-Term Holdings
In both cases, the option premium is incorporated into the stock sale. The shares purchased in 2015 (brown row) will result in a long-term capital gain while those bought in 2016 (yellow row) will result in a short-term capital gain. These returns are stated as dollar amounts, percentiles and annualized percentiles.
Discussion
Covered call writing is generally a short-term strategy that will result in short-term capital gains (losses) when trading in non-sheltered accounts. One exception to this rule is when the option is exercised on shares held for more than 1 year and 1 day in which case the resulting profits (losses) are long-term as the option premiums are incorporated into the stock sale.
Market tone
Global stocks declined this week, constrained by rising bond yields. The yield on the US 10-year Treasury note rose 10 basis points on the week to 2.39%, while the price of West Texas Intermediate crude oil declined modestly to $44.50 a barrel from $45.40 a week ago. Volatility, as measured by the Chicago Board Options Exchange Volatility Index (VIX), rose to 11.19 from 10.9 last week. This week’s economic and international news of importance:
- The minutes of the June Federal Open Market Committee meeting show that some members want to begin shrinking the Fed’s nearly $4.5 trillion balance sheet as early as September
- The minutes of the European Central Bank’s June meeting show that officials discussed whether to drop the bank’s promise to increase the pace of its asset purchases if needed to stimulate economic growth. While they refrained from making the change, it is expected they will do so some time in the next few months
- Those small shifts in tone from the central banks helped send yields higher around the globe, particularly in Europe
- Nonfarm payrolls rose a stronger-than-expected 222,000 in June, beating estimates (174,000)
- Upward revisions to April and May payrolls added an additional 47,000 jobs to those previously reported
- Despite the solid employment gains, wage growth remains muted
- The unemployment rate rose 0.1% to 4.4% as jobseekers reentered the labor force
- Leaders of the G-20 countries gathered in Hamburg, Germany this week for a summit amid growing tensions over North Korea’s missile program. On Thursday, Russia blocked a UN Security Council resolution on that would have further isolated North Korea
THE WEEK AHEAD
Mon, July 10th
China Consumer and wholesale inflation report
Wed, July 12th
United Kingdom: Employment report
Eurozone: Industrial production
Canada: Bank of Canada rate-setting meeting
United States: Yellen House Financial Services Committee testimony
Thu, July 13th
United States: Yellen Senate Banking Committee testimony
Fri, July 14th
United States: Retail sales/Consumer Price Index/industrial production
Summary
IBD: Uptrend under pressure
GMI: 2/6- Buy signal since market close of April 21, 2017
BCI: I am fully invested in the stock portion of my portfolio currently holding an equal number of in-the-money and out-of-the-money strikes. A good jobs report and a rebound in the tech sector on Friday were positives but my defensive portfolio mix remains the same.
WHAT THE BROAD MARKET INDICATORS (S&P 500 AND VIX) ARE TELLING US
The 6-month charts point to a neutral outlook. In the past six months, the S&P 500 was up 7% while the VIX (11.19) moved down by 2.5%.
Much success to all,
Alan and the BCI team