Get 40% Off
🚨 Volatile Markets? Find Hidden Gems for Serious Outperformance
Find Stocks Now

Targeting A 2015 Low

Published 06/01/2015, 12:31 AM
Updated 07/09/2023, 06:31 AM

One of the great ironies of Slope is that, in spite of it being formed as a charting/technical analysis discussion area, it has attracted a lot of folks who regard technical analysis as little better than astrology and palm-reading. All the same, in spite of near certain cat-calls and hoots from the crowd, I’d like to offer up a target low for 2015. I would add that this projection embraces my “scare the children” possibility laid out in this recent post.

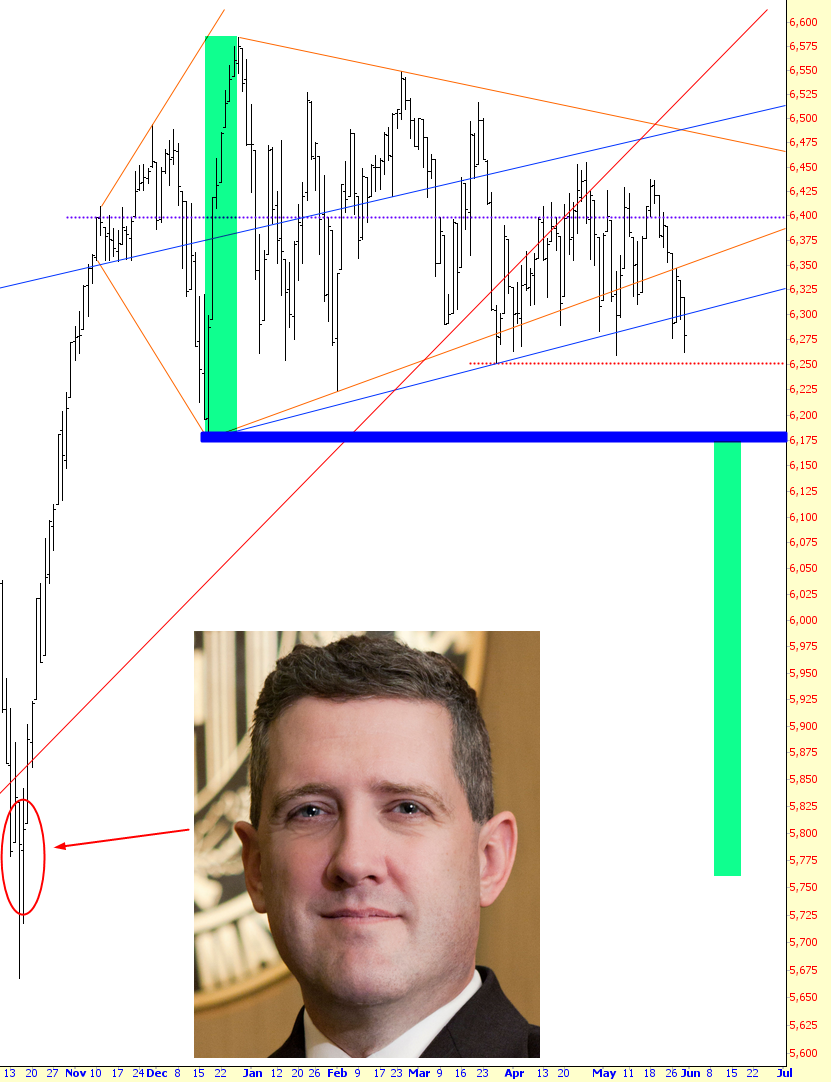
My focus is on the Dow Jones Composite, which is an index I hardly even knew existed when this year began but has become an obsession of mine. The Knight-original Ichthus pattern is one we’ve been tracking for months now, and if we can close below 6250 this week, I think it’s party time. The signs of the pattern failing are already before us.

Assuming the pattern genuinely fails (and “fails” is such a subjective, judgmental term, wouldn’t you agree?) my speculation is that the move from the pattern’s low will equal the pattern’s height, each of these denoted by the tinted green area below. Such a fall would put the index at about 5770 which, conveniently, helps it match the fabled Bullard Low of last October 15th, thus hammering in place a double bottom from which a strong rally could take place, creating badly-needed optimism for the Presidential election cycle.

COMP Chart

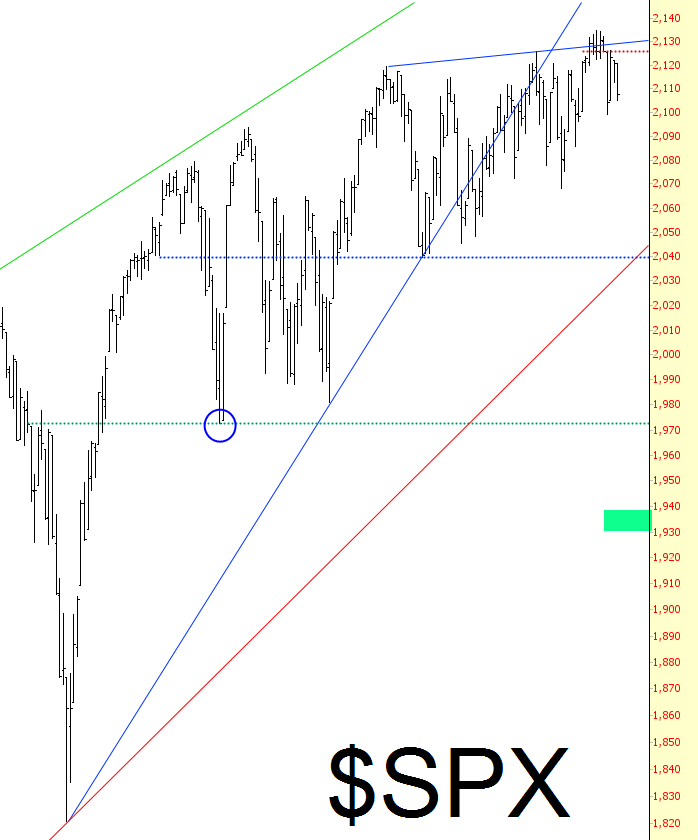
I was curious what a similar percentage drop would look like for the S&P 500, even though percentage changes from index to index definitely do not tend to match. In spite of this, I’ll say that a similar drop would put the S&P at about 1935, tinted below in green. My dumb guess is that we won’t get quite this far, instead probably stopping around the 1970 level or so, matching the lows we saw this year on February 2nd, circled below in blue. Let’s call it a truce and agree: somewhere between 1935 and 1975 (which, come to think of it, mark an era in US history of steadily-rising wages, a strong middle class, and a much more fair economy; but I digress).

3rd party Ad. Not an offer or recommendation by Investing.com. See disclosure here or remove ads .

S&P 500 Chart

Anyway, that’s it from me. Have a good Sunday, and I’ll see you when the new trading week (and new month) begins.

Latest comments

Risk Disclosure: Trading in financial instruments and/or cryptocurrencies involves high risks including the risk of losing some, or all, of your investment amount, and may not be suitable for all investors. Prices of cryptocurrencies are extremely volatile and may be affected by external factors such as financial, regulatory or political events. Trading on margin increases the financial risks.
Before deciding to trade in financial instrument or cryptocurrencies you should be fully informed of the risks and costs associated with trading the financial markets, carefully consider your investment objectives, level of experience, and risk appetite, and seek professional advice where needed.
Fusion Media would like to remind you that the data contained in this website is not necessarily real-time nor accurate. The data and prices on the website are not necessarily provided by any market or exchange, but may be provided by market makers, and so prices may not be accurate and may differ from the actual price at any given market, meaning prices are indicative and not appropriate for trading purposes. Fusion Media and any provider of the data contained in this website will not accept liability for any loss or damage as a result of your trading, or your reliance on the information contained within this website.
It is prohibited to use, store, reproduce, display, modify, transmit or distribute the data contained in this website without the explicit prior written permission of Fusion Media and/or the data provider. All intellectual property rights are reserved by the providers and/or the exchange providing the data contained in this website.
Fusion Media may be compensated by the advertisers that appear on the website, based on your interaction with the advertisements or advertisers.
© 2007-2024 - Fusion Media Limited. All Rights Reserved.