
: 49%
VIX Status: 15.6%
General (Short-term) Trading Call: Hold with a bullish bias (important caveats noted below)
Commentary
T2108 dropped to its lowest point of the year and lowest point in three months. Yet, the S&P 500 had another mild selling day losing a fraction of a percent. T2108 is dropping quickly even as the S&P 500 is ONLY 1.2% below its closing multi-year highs set at the beginning of this week. T2108 was last overbought for just one day on March 13; on that day, the S&P 500 made its big breakout move. The index is now just returning to the close of that day. I continue to interpret this stark divergence as bullish. At the current rates, T2108 will print oversold conditions just as the S&P 500 finally returns all its gains from the breakout. That moment will mark one of the more critical bear vs. bull junctures we have observed in a very long time. Even the steadily rising 50DMA may serve as support for that moment.
The slow drip of the S&P 500 has done no damage yet to the overall trend and setup
In my last T2108 update, I noted that at 59%, T2108 signaled the potential for further upside in the stock market simply by virtue of the strong likelihood of a return to overbought conditions. However, I failed to outline the scenario for a return to oversold conditions first. So, if you prefer to be bearish here, it is far from too late to enter a new position. However, I am guessing the potential returns are very small. Reversing the breakout move from here implies 1.7% downside in the S&P 500. Since I am still holding plenty of SDS (and, UGH, VXX) as hedges, I am not interested in getting even more aggressive with the bullish portfolio. Instead, I continue to focus on buying dips and flipping calls in SSO, the ProShares Ultra S&P 500, and buying VXX puts (which got a lot more expensive with today’s ugly collapse of TVIX!).
I bought two tranches of SSO calls today. I will buy more calls if the S&P 500 drops another 0.5% to 1.2% or so. IF the S&P 500′s breakout is completely reversed into a false breakout, all bets are off for the bullish case. In such a scenario, I will expect T2108 to be a very handy guide for navigating trading from that point. For now, I am not expecting a complete reversal.
Last night, I was motivated to do a chart review of FXI, the iShares Xinhua 25 Index Fund ETF given all the angst being spilled over a fifth consecutive contraction for Chinese manufacturing. In that post, I stated I could not get interested in the bearish case for FXI unless it closed at a new low. Well, it did. On heavy volume. So now FXI is officially on the bearish list even though I am positioning bullishly for the S&P 500.
Similarly, Caterpillar (CAT) continues to fade on heavy selling volume. If I did not have the bullish bias, I would have chased CAT on yesterday’s break below the 50DMA. If it breaks to a new low for the month, I will have to officially put it on the bearish list as well. In the meantime, I am holding onto puts on Terex (TEX) which I think has a LOT of downside potential if somehow the selling and bearish sentiment turns ugly.
Reviewing FXI reminded me that I have not looked at stock charts from Europe in a very long time. I was surprised by the very mixed bag of performance and could not come up with a unifying theme except that nothing that I looked at, from stocks to ETFs, had returned to multi-year highs. Some country ETFs like Spain (EWP) and Italy (EWI) are so far away from that milestone, I cannot even imagine when they will gather enough momentum to retest those lofty levels. Even the Germany ETF (EWG) remains 21% below 2011′s high although it is up a nifty 20% this year. In other words, Europe is full of bargains which could look even better if a sell-off in the U.S. drags everyone else down. I will be waiting with open arms on the next Eurozone sell-off (for some more context, see “Nassim Taleb Likes Euros And You Should Too“). Here are weekly and daily charts (respectively) of Siemens (SI) to further deliver the point of Europe’s poor relative performance:")
Siemens is struggling to regain its former momentum")
Siemens runs into stiff resistance at the breakout line AND the 200DMA
Siemens (SI) is up 7.3% for the year but is more than 40% off its recovery highs set in 2011. SI recently broke out for the third time in about six months over its 2010 breakout line. Siemens is a great example of the market’s memory regarding breakouts and the kind of selling that can occur after the market watches the entire breakout disappear. This time around, the sharply declining 200DMA added to the stiff resistance to gains above this line. SI is already at its critical juncture. Fail this latest test, and I strongly suspect the stock will drop to the lower 90s in short order.
I conclude with a little forex (foreign exchange). I have written extensively about my expectations for the Japanese yen to weaken and now my surprise at just how weak the yen has become. Even more interesting now is the almost direct correlation between yen STRENGTH and stock market weakness. Trading in the yen is once again a useful barometer for the market’s current risk appetite. The chart below shows the recent run-up in USD/JPY (you can also see the decline in the yen ETF FXE). The days of market strength in the yen versus the dollar (the red bars) correspond to all the bigger down days in the market over the past two months. I have marked the S&P 500′s daily performance at the related points. 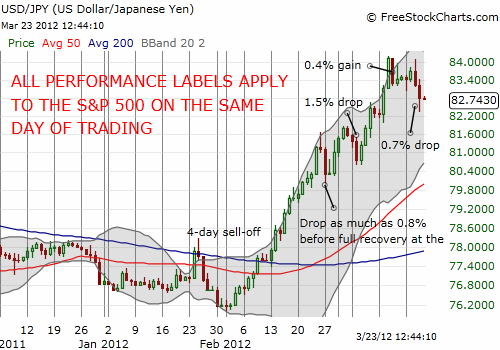 USD/JPY" title="USD/JPY" width="500" height="350">
Lately, days of yen strength have tended to correspond to days of S&P 500 weakness
Again, the labels of performance on the chart refer to the S&P 500′s performance on the given day. Out of five RARE episodes of yen strength (where USD/JPY drops), the S&P 500 was markedly down on three of them. On another day, the S&P 500 sold off only to bounce back completely for a flat close. These correlations make me wonder whether the Japanese yen is getting sold (borrowing at low rates) to buy stocks. This is just speculation for now, but something to consider.
So, overall, I am maintaining my bullish bias and feel much better about it with T2108 a full 20 percentage points away from overbought levels. Recall that my bullish bias is based on my historical analysis of overbought periods.
I will continue to flip quickly in and out of SSO calls and VXX puts as I expect the market to churn a lot up and down before T2108 gets “resolved” to oversold or overbought. If the current pace continues, T2108 could be oversold sometime next week. HOWEVER, T2108 is developing a VERY curious trend. The daily chart posted below at the time of this post shows T2108 making a series of higher lows since the gut-wrenching lows of last summer. This trend will only hold up, if T2108 stops its losses between 40% and current levels.
If the S&P 500′s breakout is violated at the same time T2108 flips oversold, I will have a really challenging decision to make…
Charts below are the latest snapshots of T2108 (and the S&P 500) Refresh browser if the charts are the same as the last T2108 update.
Black line: T2108 (measured on the right); Green line: S&P 500 (for comparative purposes)
Full disclosure: long SDS and VXX; long CAT calls, shares, and puts; long SSO calls, long TEX puts, long USD/JPY
- English (UK)
- English (India)
- English (Canada)
- English (Australia)
- English (South Africa)
- English (Philippines)
- English (Nigeria)
- Deutsch
- Español (España)
- Español (México)
- Français
- Italiano
- Nederlands
- Português (Portugal)
- Polski
- Português (Brasil)
- Русский
- Türkçe
- العربية
- Ελληνικά
- Svenska
- Suomi
- עברית
- 日本語
- 한국어
- 简体中文
- 繁體中文
- Bahasa Indonesia
- Bahasa Melayu
- ไทย
- Tiếng Việt
- हिंदी
T2108 Update – March 22, 2012 (Maintaining Bullish Bias Even As Bearish Case Grows)
Published 03/23/2012, 02:24 AM
Updated 07/09/2023, 06:31 AM
T2108 Update – March 22, 2012 (Maintaining Bullish Bias Even As Bearish Case Grows)
T2108 Status
Latest comments
Loading next article…
Install Our App
Risk Disclosure: Trading in financial instruments and/or cryptocurrencies involves high risks including the risk of losing some, or all, of your investment amount, and may not be suitable for all investors. Prices of cryptocurrencies are extremely volatile and may be affected by external factors such as financial, regulatory or political events. Trading on margin increases the financial risks.
Before deciding to trade in financial instrument or cryptocurrencies you should be fully informed of the risks and costs associated with trading the financial markets, carefully consider your investment objectives, level of experience, and risk appetite, and seek professional advice where needed.
Fusion Media would like to remind you that the data contained in this website is not necessarily real-time nor accurate. The data and prices on the website are not necessarily provided by any market or exchange, but may be provided by market makers, and so prices may not be accurate and may differ from the actual price at any given market, meaning prices are indicative and not appropriate for trading purposes. Fusion Media and any provider of the data contained in this website will not accept liability for any loss or damage as a result of your trading, or your reliance on the information contained within this website.
It is prohibited to use, store, reproduce, display, modify, transmit or distribute the data contained in this website without the explicit prior written permission of Fusion Media and/or the data provider. All intellectual property rights are reserved by the providers and/or the exchange providing the data contained in this website.
Fusion Media may be compensated by the advertisers that appear on the website, based on your interaction with the advertisements or advertisers.
© 2007-2024 - Fusion Media Limited. All Rights Reserved.