
T2108 Status: 46.3%
T2107 Status: 48.1%
VIX Status: 14.0
General (Short-term) Trading Call: Neutral
Active T2108 periods: Day #168 over 20%, Day #127 above 30%, Day #3 over 40% (overperiod), Day #21 under 50% (underperiod), Day #38 under 60%, Day #237 under 70%
Commentary
Last week I decided to embrace the chop, and the results were pretty good. In the last T2108 Update, I reviewed the results of the previous week’s trades which took advantage of a bounce I anticipated based on T2108. I was wary about the coming Federal Reserve’s meeting and did not want to make any predictions for last week. However, when Monday (June 18th) delivered a down day, I sprung into action…
Sure enough, the S&P 500 (SPDR S&P 500 (ARCA:SPY)) bounced off its lows which happened to poke through the lower-Bollinger Band® (BB). The bounce continued for three straight days until Friday’s pullback toward the 50DMA. The end result was almost typical chop action as the index closed at the highs of the previous week.
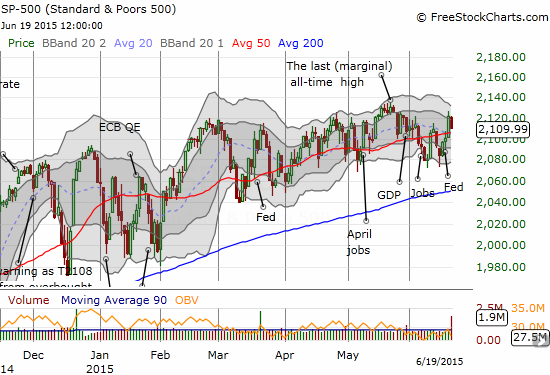
Yet more chop for the S&P 500. Note how the range has tightened since March
There were several keys to my belief that the good risk/reward trade was to go long even ahead of knowing what the Fed would do to calm the market’s nerves. I noted the surprisingly complacent response in the forex market to the latest round of Greek drama: the European Central Bank (ECB) even warned that it did not know whether Greek banks would have money in a week! There was also the volatility index, the VIX, which had once again bumped right into the pivot poiint…and stopped cold.

The volatility index has been unable to gain any momentum as the 15.35 pivot continues to hold as tough resistance
Finally, there is of course my favorite technical indicator, T2108. T2108 plunged back to the recent lows on Monday, so all I had to do was bet that it would bounce from that support. As a reminder, the neighborhood of 30% has consistently proven itself as “close enough” to oversold in this market. T2108 dropped as low as 31.2%. It got as high as 50.7% on Thursday. That is quite a range! And that range provided a lot of room for bullish trades.
As readers may recall, I have my eyes trained on Netflix (NASDAQ:NFLX) and Amazon.com (NASDAQ:AMZN) for swing trades. Those stocks were automatic selections on Monday for call options. I went after Apple (NASDAQ:AAPL) which has the additional feature of pivoting around its 50DMA. I was also very aggressive in executing on my trading strategy for United States Oil Fund LP (NYSE:USO). The USO trades required both call and put options as USO swung away from and back to its 50DMA. My successes in all these trades appear to validate my approaches. I also went to the well again on call options for ProShares Ultra S&P500 (ARCA:SSO) and was even able to salvage most of the value of the previous week’s SSO call options. The only trade I missed that I should have made was on iShares MSCI Emerging Markets ETF (ARCA:EEM). This was partially a function of already having call options left over from previous hedged trades. My last set of puts closed out successfully in the previous week. EEM did not reach a “natural” point of resistance, so I did not reload on put options.
Here are the relevant charts along with other charts of interest…
 test of NFLX's 20DMA uptrend.")
Netflix (NFLX) started the week with a gap down and bounced neatly off the first Bollinger Band. After a 1-day follow-through, NFLX churned the rest of the week. I am next looking for a (buyable) test of the 20DMA uptrend.

Amazon.com (AMZN) has yet to resolve its Bollinger Band squeeze. In the meantime it is bouncing reliably inside a tight trading channel. The selling to start the week took AMZN to the bottom. On Friday, a breakout from the channel was quickly faded.
Apple (AAPL) bounced from Monday’s selling but failed to break through the 50DMA pivot. Friday’s rejection makes the 50DMA look more like solid resistance. Caution!

United States Oil Fund LP (USO) is caught in a 6-week trading range. The chop is tightening ever so slightly as the 50DMA rises through the middle. I am looking for it to go from simple support to pivot.

iShares MSCI Emerging Markets ETF (ARCA:EEM) continues to struggle as a downtrend builds from the April high

QE announcements are still holding as tops for the euro against the U.S. dollar. Note the steady drift upward for EUR/USD since the strong reaction to eurozone CPI.

Shake Shack (NYSE:SHAK) is in bigger trouble now with a lock-up expiration looming. The abandoned baby top is looking more and more like a firm top as SHAK has no broken down below its 50DMA. A feeble retest on Friday was easily rejected by sellers.

Box, Inc. (BOX) has failed to generate any momentum since its IPO. The extended trading range since then is chopping tighter and tighter. With two poor reactions to earnings, I am looking for an eventual breakdown to new lows.

The chopping range for Oracle (ORCL) looks ready to breakdown. Although the initial post-earnings break of 200DMA support was reversed, the next day’s selling reinforced the damage.

The iShares Nasdaq Biotechnology ETF (NASDAQ:IBB) has valiantly fought through several bearish signals. The new all-time high signals potential for a fresh run-up.
Daily T2108 vs the S&P 500")
Black line: T2108 (measured on the right); Green line: S&P 500 (for comparative purposes)
Red line: T2108 Overbought (70%); Blue line: T2108 Oversold (20%)

Be careful out there!
Disclosure: long SHAK, short the euro, short BOX