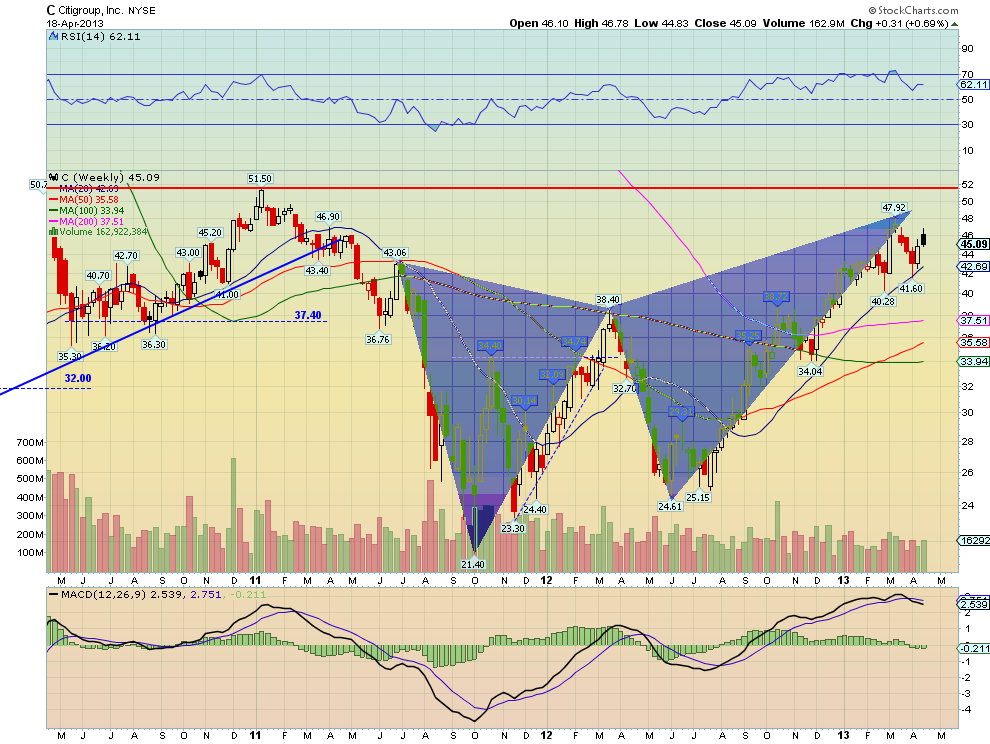
Citigroup (C) reported earnings on Monday, tax day, what seems eons ago, and ran higher. We traded it in the premium area for a good gain. It has interest now because of the Bearish Butterfly shown in the weekly chart below. This pattern has a target for a reversal at 48.90, a point it is falling just short of. On a reversal lower, it has a target of 38.40, very near the 200 week Simple Moving Average (SMA) on this chart. 
The Relative Strength Index (RSI) is making lower lows and the Moving Average Convergence Divergence (MACD) indicator is starting to roll lower. Seems a break under 42.70, whether it hits the Butterfly target or not, is a good longer term short entry. It could also just fake out every one and cause that pattern to fail with a move over 51.50 - either way it has potential. One way to play this is to buy the July 42/50 Strangle right now. This is offered at $2.10 late Thursday (4.65%), and has 3 months to play out. The great news is that this stock also has weekly options. So you can sell a weekly Strangle against it each week for 13 weeks to recoup your cost while waiting for a big move, expecting them to expire each week. If you do not have time to watch every week, no problem, do it less frequently.
Original post
- English (UK)
- English (India)
- English (Canada)
- English (Australia)
- English (South Africa)
- English (Philippines)
- English (Nigeria)
- Deutsch
- Español (España)
- Español (México)
- Français
- Italiano
- Nederlands
- Português (Portugal)
- Polski
- Português (Brasil)
- Русский
- Türkçe
- العربية
- Ελληνικά
- Svenska
- Suomi
- עברית
- 日本語
- 한국어
- 简体中文
- 繁體中文
- Bahasa Indonesia
- Bahasa Melayu
- ไทย
- Tiếng Việt
- हिंदी
Strangling Citigroup
Published 04/18/2013, 01:58 AM
Updated 05/14/2017, 06:45 AM
Strangling Citigroup
Latest comments
Loading next article…
Install Our App
Risk Disclosure: Trading in financial instruments and/or cryptocurrencies involves high risks including the risk of losing some, or all, of your investment amount, and may not be suitable for all investors. Prices of cryptocurrencies are extremely volatile and may be affected by external factors such as financial, regulatory or political events. Trading on margin increases the financial risks.
Before deciding to trade in financial instrument or cryptocurrencies you should be fully informed of the risks and costs associated with trading the financial markets, carefully consider your investment objectives, level of experience, and risk appetite, and seek professional advice where needed.
Fusion Media would like to remind you that the data contained in this website is not necessarily real-time nor accurate. The data and prices on the website are not necessarily provided by any market or exchange, but may be provided by market makers, and so prices may not be accurate and may differ from the actual price at any given market, meaning prices are indicative and not appropriate for trading purposes. Fusion Media and any provider of the data contained in this website will not accept liability for any loss or damage as a result of your trading, or your reliance on the information contained within this website.
It is prohibited to use, store, reproduce, display, modify, transmit or distribute the data contained in this website without the explicit prior written permission of Fusion Media and/or the data provider. All intellectual property rights are reserved by the providers and/or the exchange providing the data contained in this website.
Fusion Media may be compensated by the advertisers that appear on the website, based on your interaction with the advertisements or advertisers.
© 2007-2024 - Fusion Media Limited. All Rights Reserved.
