If we compare Australia with major world economies, we see a very nice picture. The country has low a unemployment rate, low inflation and low government spending, accompanied by one of the fastest growing GDPs. However, there could be a storm coming, as we can already spot the dark clouds if we look closer at the main factors that moved the Aussie economy the last year…
The next release of GDP will available on 7th of December, the day after the rate decision. Altough we will get some hints from the RBA Rate Statement tonight, many traders are asking what to expect? So lets look at few details.
Despite generally bad outlook at the beginning of 2015, the Australian economy managed to perform well in the 2015/2016 financial year, although worrying signs are still in place.
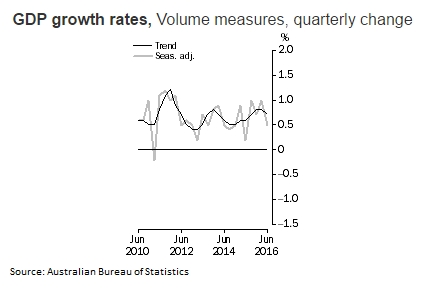
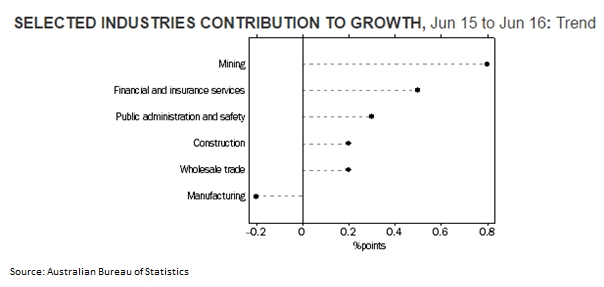
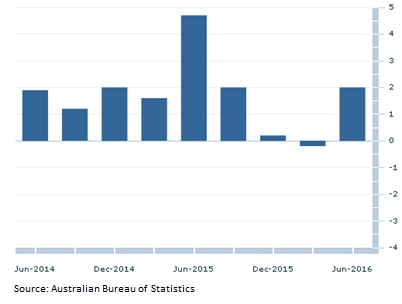
While the year on year GDP growth, measured by comparing same quarters of 2 years, grew to 3.3%, the growth slowed down in the second quarter from 1% (downward revision from 1.1%) to only 0.5% in the Q2. In order to be able to make an estimate or just to have a feeling about the upcoming GDP, we can look at the key sectors contributing the most to the growth of the economy. Mining and construction both making up a significant part of the Gross Domestic Product trend.
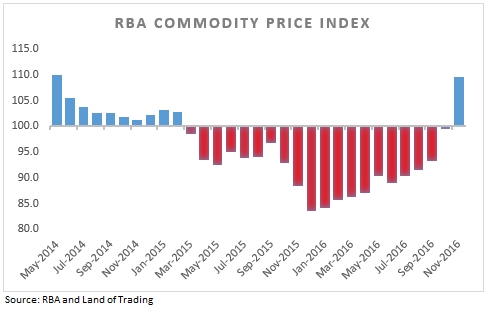
In Q2, growth was supported mainly the mining sector which added 0.8% while construction added 0.2% , and financial and insurance services had a high 0.5% impact. The impact of mining could be positive this year, as it came mostly from mineral exploration, which was caused by the increase in commodity prices this year which keep rising massively.
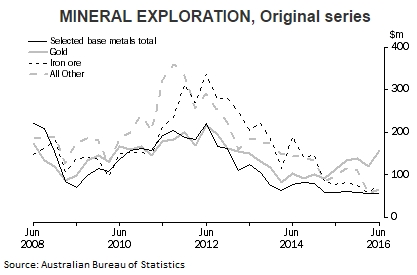
The overall mineral exploration activity was flat in the second quarter, but gold and iron ore bounced from the first quarter bottom as you can see from the chart below. As the prices of these two continued to rise in the third quarter, this can have again large positive affect on the GDP growth. Also, RBA expects the investments in the industry to pick up soon.
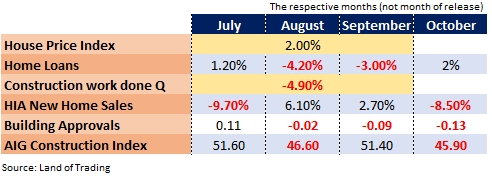
However, before we get overly optimistic, let’s also look at the housing market, which is the key concern of the policy makers currently. The figures released in November show that these concerns have a good base, as all the housing components show negative or flat trend, except maybe home loans.
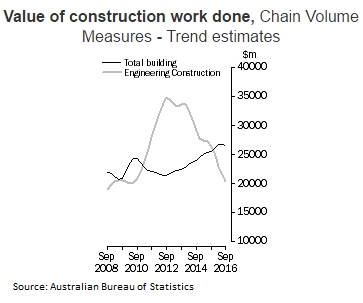
One of the most followed housing indicator is the construction output due to its complexity and as it covers a whole quarter of production. In the third quarter, the finished construction works fell by 4.9%. To have an idea how serious it is, the construction output didn’t fall this much in a quarter for the last 16 years.
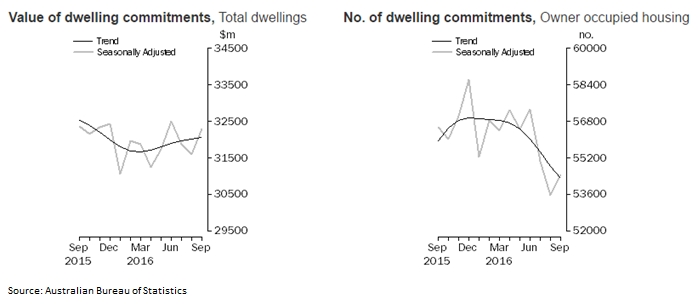
What is worse, the future doesn’t look brighter either. While housing prices in major cities started to rise again in the second quarter, the demand for owner occupied housing is declining. This will likely cause further decline in construction output in the coming months if investment housing will not be able to compensate this outage in demand.
The change in the trend of demand is clearly visible in dwelling commitments. The dwellings commitments were falling rapidly in the summer. Despite the overall housing commitments rebounded in September 2.3% the problem is visible if we break down the numbers. The investment housing increased by 4.6% compared to the number of owner occupied dwelling which increased only by 0.9%.
The change in the number of commitments is showing us the story behind. One of the best value indicators are owner occupied house and apartments purchases. While the increase in the number of these dwellings was the same (0.9%) as the increase of value of this housing, the number of investment housing increased only by 2.0 % compared to the increase in the value at 4.6%. This indicates a shift in demand toward a more expensive or even luxurious housing investments.
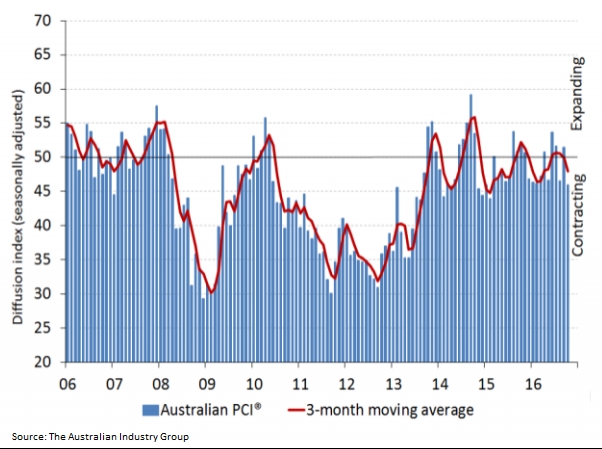
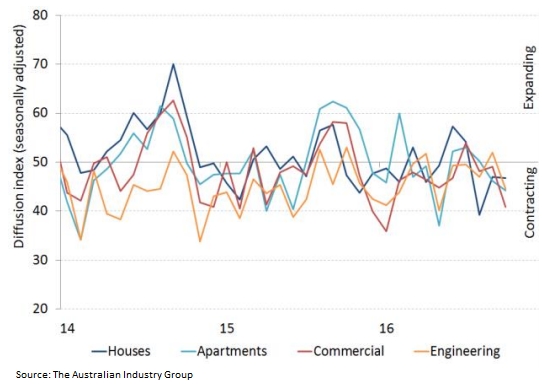
Another great indicator is the mood amongst builders, which is definitely not optimistic, either. While in September the Construction Index published by AIG rose above the key 50 points level, it fell again sharply in October. This indicates, that the construction companies already feel the pain and in this environment they will likely be reluctant to start new development projects.
According to the AIG report, one of the reasons behind the worsening sentiment is the new orders. These were falling overall in the construction business but the demand for houses and appartments declined significantly the last few months.
As we went quickly through two major GDP components, it seems that the very positive outlook in mining may be mostly offset by the problems in the construction sector. This sector can also influence the financial services in a negative way. This sector is also a signifcant part of the country's GDP, so the effect could be stronger.
I expect a significant decline in the quarterly growth rate, despite the supporting efect of rising commodity prices on mining activity. The reason for this decline is the fact that the two sectors will compensate each other, hence the effect would be neutral, which is equal to no or minimum growth in the two sectors together. It seems that market has still not really priced in this possible change and therefore, be prepared to sell the fact after the release.
Remember to always watch your risk and be consistent.
Mr. Tech Man
DISCLAIMER: This material was created for informational purposes only and represents the Land of Trading team’s view of the past and current economic and capital market environment. It is not an investment advice and should not be viewed that way at all, and the creators of this material cannot be held liable for any potential losses resulting from trading, where despite this disclaimer someone would consider this material as an investment advice. All rights reserved ©2016.


